Multicenter Study
. 2009 Jul;132(Pt 7):1866-81.
doi: 10.1093/brain/awp102. Epub 2009 May 6.

Cortical spreading ischaemia is a novel process involved in ischaemic damage in patients with aneurysmal subarachnoid haemorrhage

Affiliations
Multicenter Study

Cortical spreading ischaemia is a novel process involved in ischaemic damage in patients with aneurysmal subarachnoid haemorrhage

Jens P Dreier et al. Brain. 2009 Jul.

Abstract

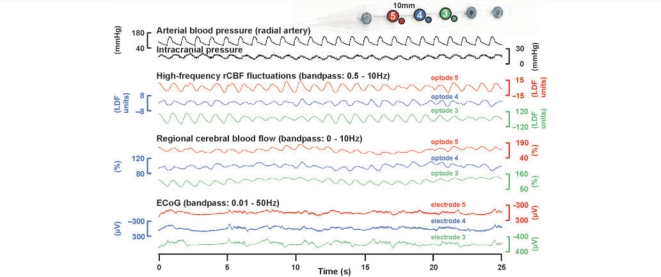
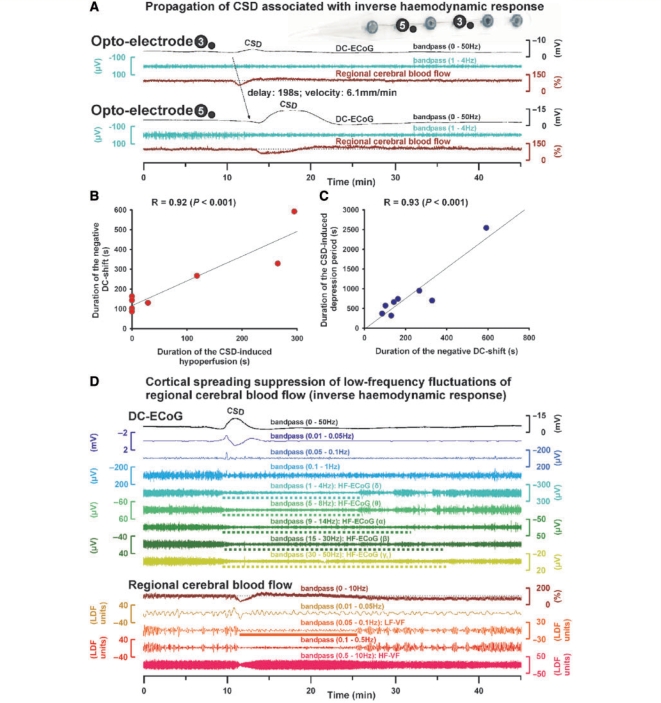
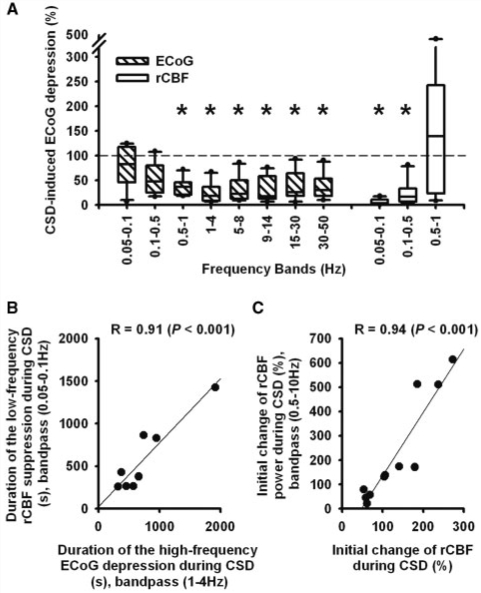
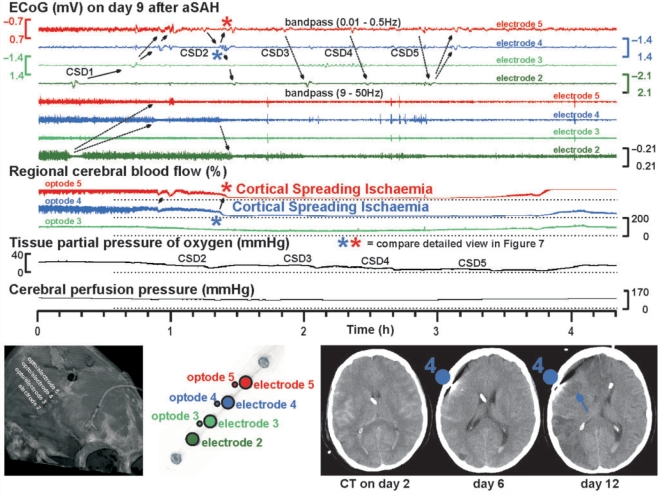
The term cortical spreading depolarization (CSD) describes a wave of mass neuronal depolarization associated with net influx of cations and water. Clusters of prolonged CSDs were measured time-locked to progressive ischaemic damage in human cortex. CSD induces tone alterations in resistance vessels, causing either transient hyperperfusion (physiological haemodynamic response) in healthy tissue; or hypoperfusion [inverse haemodynamic response = cortical spreading ischaemia (CSI)] in tissue at risk for progressive damage, which has so far only been shown experimentally. Here, we performed a prospective, multicentre study in 13 patients with aneurysmal subarachnoid haemorrhage, using novel subdural opto-electrode technology for simultaneous laser-Doppler flowmetry (LDF) and direct current-electrocorticography, combined with measurements of tissue partial pressure of oxygen (ptiO(2)). Regional cerebral blood flow and electrocorticography were simultaneously recorded in 417 CSDs. Isolated CSDs occurred in 12 patients and were associated with either physiological, absent or inverse haemodynamic responses. Whereas the physiological haemodynamic response caused tissue hyperoxia, the inverse response led to tissue hypoxia. Clusters of prolonged CSDs were measured in five patients in close proximity to structural brain damage as assessed by neuroimaging. Clusters were associated with CSD-induced spreading hypoperfusions, which were significantly longer in duration (up to 144 min) than those of isolated CSDs. Thus, oxygen depletion caused by the inverse haemodynamic response may contribute to the establishment of clusters of prolonged CSDs and lesion progression. Combined electrocorticography and perfusion monitoring also revealed a characteristic vascular signature that might be used for non-invasive detection of CSD. Low-frequency vascular fluctuations (LF-VF) (f < 0.1 Hz), detectable by functional imaging methods, are determined by the brain's resting neuronal activity. CSD provides a depolarization block of the resting activity, recorded electrophysiologically as spreading depression of high-frequency-electrocorticography activity. Accordingly, we observed a spreading suppression of LF-VF, which accompanied spreading depression of high-frequency-electrocorticography activity, independently of whether CSD was associated with a physiological, absent or inverse haemodynamic response. Spreading suppressions of LF-VF thus allow the differentiation of progressive ischaemia and repair phases in a fashion similar to that shown previously for spreading depressions of high-frequency-electrocorticography activity. In conclusion, it is suggested that (i) CSI is a novel human disease mechanism associated with lesion development and a potential target for therapeutic intervention in stroke; and that (ii) prolonged spreading suppressions of LF-VF are a novel 'functional marker' for progressive ischaemia.


Figures

Figure 1
Figure 1
Obvious coherences (i) between high-frequency-ECoG activities at different electrodes, (ii) between LF-VF at different optodes and (iii) between HF-VF, arterial pulse and intracranial pressure fluctuations. The ECoG shows a burst suppression pattern (Case 10).
Figure 2
Figure 2
Spreading depression of high-frequency-ECoG activity and spreading suppression of LF-VF correlate in the human brain during physiological and absent haemodynamic responses to CSD, respectively. (A) On the upper right, the opto-electrode strip is shown. The 12 traces represent simultaneous recordings of a single CSD (Case 7) that propagated from opto-electrode 6 (Traces 1–6) to 4 (Traces 7–12). The calibration bars at opto-electrode 4 (Traces 7–12) also apply to the corresponding traces at opto-electrode 6 (Traces 1–6). Opto-electrode 6: the first three traces identify the CSD electrophysiologically. Trace 1 (black): full-band ECoG changes including the negative DC potential; Trace 2 (light blue): depression of high-frequency-ECoG activity (δ-band); Trace 3 (green): integral of power of the δ-band, used to calculate the depression period. Trace 4 (brown) (full-band regional cerebral blood flow signal): displays a flow increase characteristic of the physiological haemodynamic response to CSD. LF-VF (0.05–0.1 Hz) and HF-VF (0.5–10 Hz) are contained in the full-band regional cerebral blood flow signal. During CSD, the LF-VF (Trace 5) became suppressed, while the HF-VF (Trace 6) increased underscoring their differential nature (HF-VF = pulse). Note that the LF-VF recovery (Trace 5) starts at a similar moment as the recovery of the high-frequency-ECoG (Trace 2). Opto-electrode 4: the CSD spread from opto-electrode 6–4 at a rate of 1.9 mm/min. The changes at opto-electrode 4 are similar to those at opto-electrode 6. Importantly, note simultaneous propagation of the spreading suppression of LF-VF and the spreading depression of high-frequency-ECoG. (B) The 14 traces represent simultaneous recordings of a single CSD (Case 3) at opto-electrode 5. The nine traces of the upper part identify the CSD electrophysiologically. The five traces of the lower part characterize the regional cerebral blood flow response, remarkable for only a very marginal increase of regional cerebral blood flow (absent haemodynamic response to CSD). Upper part: Trace 1 (black): full-band ECoG changes of CSD including DC potential; Traces 2–9 (different shades of blue and green): different frequency bands contained in the full-band signal of Trace 1. The frequency band of 0.01–0.05 Hz (Trace 2) has been used previously to identify the SPC in the human brain (Dreier et al., ; Fabricius et al., 2006). The advantage of the (unfiltered) DC potential over this frequency band is that the duration of the DC negativity is a summary measure that reflects the time period until the energy dependent repolarization. The depression of ECoG activity is best seen in the higher frequency bands [δ (Trace 5), θ (Trace 6), α (Trace 7), β (Trace 8) and γL (Trace 9)], whilst it is less obvious in the lower frequency bands (traces 3 and 4). Lower part: Trace 10 (brown) (full-band regional cerebral blood flow signal): displays no significant perfusion change (absent haemodynamic response to CSD). Traces 11–14: different frequency bands contained in the full-band signal of regional cerebral blood flow. Note the strong suppression of the LF-VF (Trace 12, orange) despite the absence of a significant perfusion change in Trace 10. Also note that the durations of the suppression of LF-VF (solid horizontal bar, Trace 12) and the depression of high-frequency-ECoG activity (δ-γL frequency bands, broken horizontal bars, Traces 5–9) are similar. Also note that the durations of the depression periods of LF-VF and HF-ECoG are significantly longer in (B) (absent haemodynamic response to CSD) compared with (A) (physiological haemodynamic response to CSD) consistent with the notion that the recovery of synaptic activity depends on energy supplied by regional cerebral blood flow.
Figure 3
Figure 3
Inverse haemodynamic response to CSD. (A) On the upper right, the opto-electrode strip is shown. The six traces represent simultaneous recordings of a single CSD with inverse haemodynamic response (Case 8) that propagated from opto-electrode 3 (Traces 1–3) to 5 (Traces 4–6). Note that the CSD-induced initial hypoperfusion at optode 5 lasts for 4.9 min and is associated with a prolonged negative DC shift lasting for 9.9 min. The prolongation of the direct current negativity renders this hypoperfusion a CSI, meaning that it produces a delay of the energy dependent recovery from the extracellular direct current negativity (reflecting intracellular sodium and calcium surge). Note that the durations of direct current negativity and CSD-induced hypoperfusion are similar at opto-electrode 5 and markedly longer lasting than those at opto-electrode 3. (B) Linear regression showing that the durations of initial hypoperfusion and cortical DC negativity are correlated [compare (A)]. (C) Linear regression showing that the durations of cortical DC potential negativity and energy-dependent recovery of high-frequency-ECoG activity are correlated. (D) Fourteen traces showing simultaneous recordings of a single CSD (Case 11) at opto-electrode 3 associated with inverse haemodynamic response. The nine traces of the upper part identify the CSD electrophysiologically similarly as in Fig. 2B. The five traces of the lower part characterize regional cerebral blood flow. The duration of CSI (Trace 10, brown) was 2 min, the duration of the negative DC shift (Trace 1, black) 4.5 min. Note simultaneous long-lasting depression of high-frequency-ECoG activity (broken horizontal bars in Traces 5–9) and suppression of LF-VF (solid horizontal bar in Trace 12, orange).
Figure 4
Figure 4
The physiological haemodynamic response to CSD is associated with spreading hyperoxia, whilst the inverse haemodynamic response is associated with spreading hypoxia. (A) Three CSDs are shown (Case 12) characterized by a SPC (Trace 1, blue line, lower frequency limit 0.01 Hz), a short-lasting depression of the high-frequency-ECoG activity (Trace 2, green), initial hyperaemia (Trace 3, brown, physiological haemodynamic response to CSD) and tissue hyperoxia (Trace 4, black, arrows). (B) Two CSDs are shown (Case 11) characterized by a SPC (Trace 1, blue), a longer-lasting depression of the high-frequency-ECoG activity (Trace 2, green), CSI (Trace 3, brown, inverse haemodynamic response to CSD) and tissue hypoxia (Trace 4, black, arrows). (C) A seizure is given (Case 4) with only minor SPC (Trace 1) compared with that of a CSD, rhythmic 4/s δ-activity (amplitude: ∼700 µV) (Trace 2), hyperaemia (Trace 3) and hyperoxia (Trace 4, arrow). (D) Linear regression showing correlation between the initial changes in level of regional cerebral blood flow and parenchymal ptiO2 in response to CSD.
Figure 5
Figure 5
Spreading depression of high-frequency-ECoG activity and spreading suppression of LF-VF correlate in the human brain. (A) CSD-induced spreading depression is significant in the high-frequency bands of the ECoG and spreading suppression in the low-frequency bands of regional cerebral blood flow. (B) The durations of spreading suppression of LF-VF and spreading depression of high-frequency-ECoG correlate. (C) The mean initial change of HF-VF correlates with the mean initial perfusion change in response to CSD. Thus, HF-VF might be a simple measure to estimate the perfusion change in response to CSD using non-invasive recording technology. The findings were similar if the bandwidth of HF-VF was limited to 0.5–2 Hz, more suitable for non-invasive technologies with lower sampling rates.
Figure 6
Figure 6
CSI in the human brain (same CSI as in Fig. 7 at higher temporal resolution). (A) Note the spreading SPC from electrode 4 (Trace 2, blue) to 5 (Trace 1, red) (velocity of 4.8 mm/min). The onsets of the negative SPC (Trace 2) and depression of the high-frequency-ECoG activity (Trace 4) at electrode 4 clearly preceded the onset of the steep decline of regional cerebral blood flow at optode 4 (Trace 6). If SPC and ECoG depression had been the consequence of the steep regional cerebral blood flow decline, they should have followed it with a delay of 2.5–5 min (Leão, 1947). At opto-electrode 5, the high-frequency-ECoG activity (Trace 3) was already depressed from a previous CSD and the SPC (Trace 1) was rather small. Importantly, the steep decline of regional cerebral blood flow propagated from optode 4 (Trace 6) to 5 (Trace 5) at a characteristic rate of 4.9 mm/min (arrows). The spread was also visible in the suppressions of the LF-VF (traces 7 and 8) and HF-VF (traces 9 and 10). The suppressions of the HF-VF (traces 9 and 10) developed steeply but not in a step-like fashion contrasting other ischaemic aetiologies such as thread occlusion, embolism or cardiac arrest. (B) Lower time resolution than (A) showing the parallel, progressive suppression of the LF-VF (Trace 4) and depression of the high-frequency-ECoG activity (traces 2 and 3) at opto-electrode 4 during the cluster of CSDs resulting in CSI (Trace 5). Some suppression/depression precedes the appearance of the first SPC (Trace 1) reflected in both LF-VF and high-frequency-ECoG activity. TRACE 6 shows the HF-VF correlating with the changes in level of regional cerebral blood flow.
Figure 7
Figure 7
CSI in the human brain (at lower temporal resolution than in Fig. 6). On Day 9, this 62-year-old patient suddenly developed a cluster of CSDs. The position of the original recording strip in relation to the skull is shown in the left lower corner. The upper four traces show the SPCs of electrodes 5–2. The next four traces represent the high-frequency-ECoG activity. Note that the cluster paradoxically started at electrode 2 with only short-lasting depression period and no infarct demarcation in the CT of Day 12. The further complex propagation of the CSDs is illustrated by the arrows. Traces 9–11: regional cerebral blood flow changes at optodes 5–3. The stars indicate the onset of CSI (compare Fig. 6A for higher temporal resolution). Note the long-lasting CSI at optodes 4 and 5 in response to CSD at electrodes 4 and 5. The CSI is accompanied by local decrease of ptiO2 (Trace 12). After CSI the high-frequency-ECoG activity remained depressed at all electrodes apart from electrode 2 (traces 5–8) corresponding with permanent ischaemic loss of neuronal function. Compared to the CTs of Days 2 and 6 with only oedema, the CT of Day 12 showed new hypodensities typical of delayed ischaemic infarcts including the recording areas of opto-electrodes 4 and 5 (right lower corner). This suggested that the recorded hypoperfusion had reached the ischaemic range. The oedema on the CT of Day 6 was already seen on the CTs of Days 0, 1 and 2 suggesting that the initial haemorrhage was the cause. CT cannot differentiate whether the nature of this oedema was vasogenic or cytotoxic. Thus, early ischaemic damage remains a possibility and the images do not provide definitive evidence that the demarcated infarcts on the CT of Day 12 only developed between Days 6 and 12. However, if the tissue had not been viable before the CSI on Day 9, it would not have displayed ECoG activity. Furthermore, a process of infarct demarcation over a period of more than 6 days would be unusual.

References

    1. Attwell D, Iadecola C. The neural basis of functional brain imaging signals. Trends Neurosci. 2002;25:621–5. - PubMed
    1. Back T, Kohno K, Hossmann KA. Cortical negative DC deflections following middle cerebral artery occlusion and KCl-induced spreading depression: effect on blood flow, tissue oxygenation, and electroencephalogram. J Cereb Blood Flow Metab. 1994;14:12–9. - PubMed
    1. Barth M, Capelle HH, Weidauer S, Weiss C, Münch E, Thomé C, et al. Effect of nicardipine prolonged-release implants on cerebral vasospasm and clinical outcome after severe aneurysmal subarachnoid hemorrhage: a prospective, randomized, double-blind phase IIa study. Stroke. 2007;38:330–6. - PubMed
    1. Basarsky TA, Duffy SN, Andrew RD, MacVicar BA. Imaging spreading depression and associated intracellular calcium waves in brain slices. J Neurosci. 1998;18:7189–99. - PMC - PubMed
    1. Biswal B, Yetkin FZ, Haughton VM, Hyde JS. Functional connectivity in the motor cortex of resting human brain using echo-planar MRI. Magn Reson Med. 1995;34:537–41. - PubMed

Publication types