. 2009 May 15;122(Pt 10):1626-36.
doi: 10.1242/jcs.045625.

ATF6alpha induces XBP1-independent expansion of the endoplasmic reticulum

Affiliations

ATF6alpha induces XBP1-independent expansion of the endoplasmic reticulum

Hemamalini Bommiasamy et al. J Cell Sci. .

Abstract

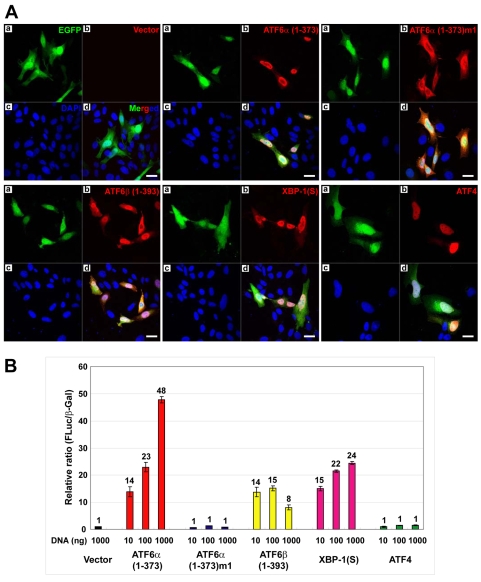
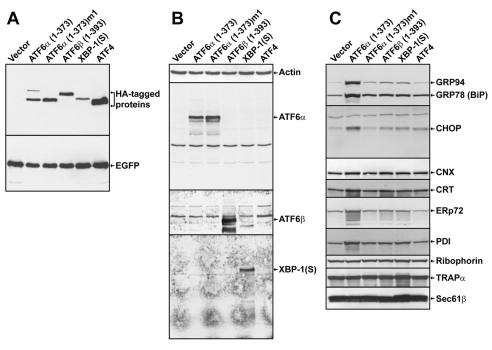
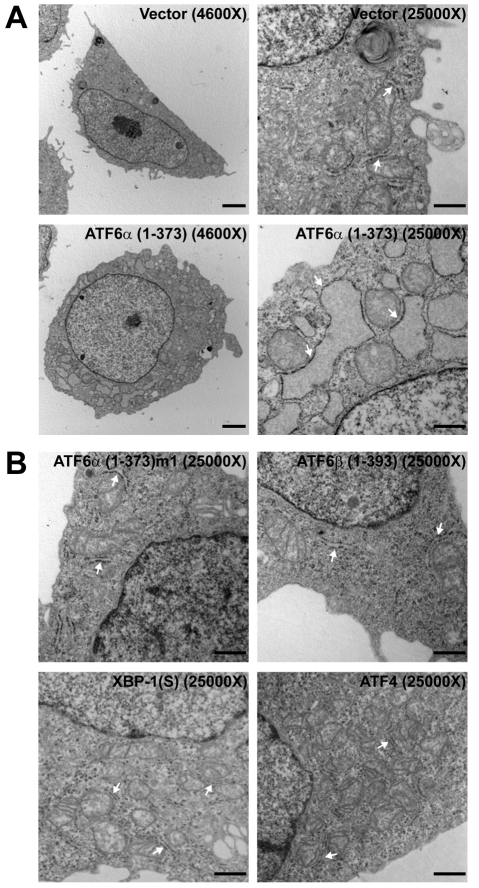
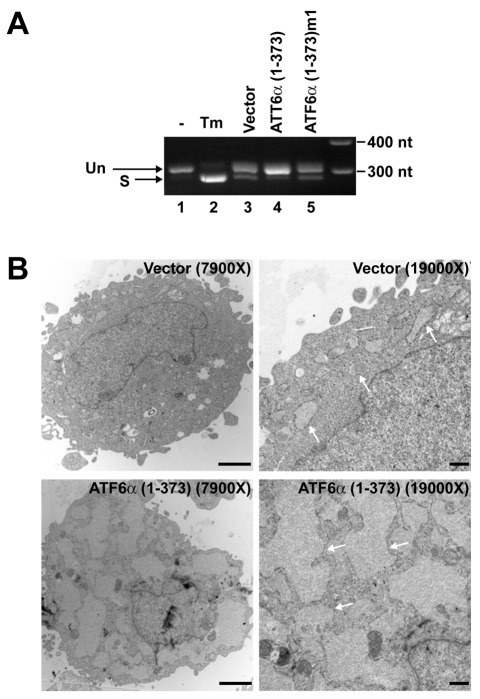
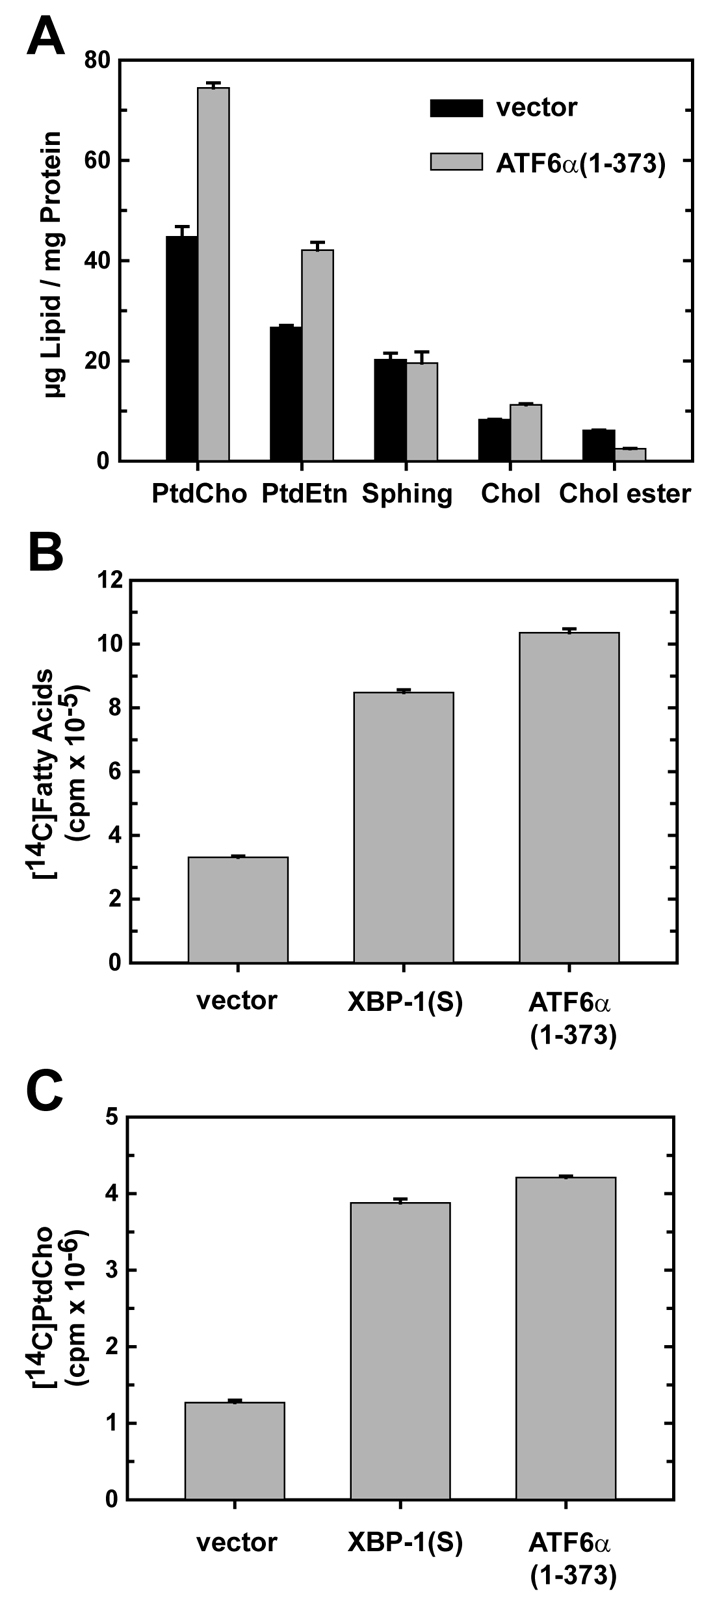
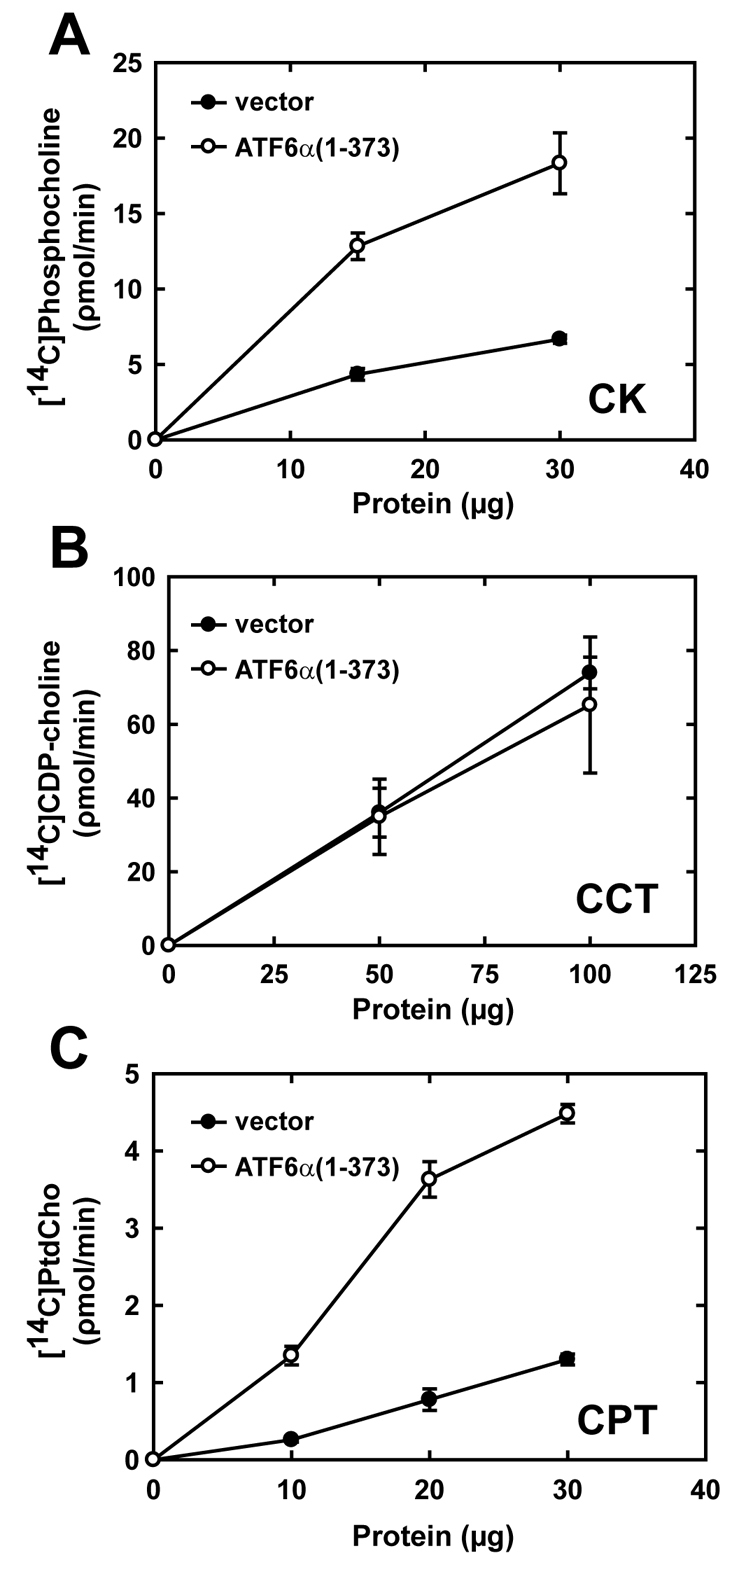
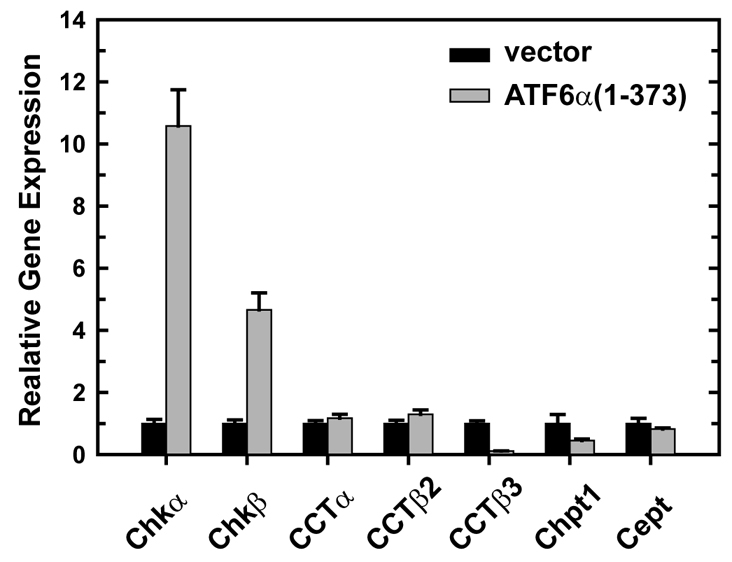
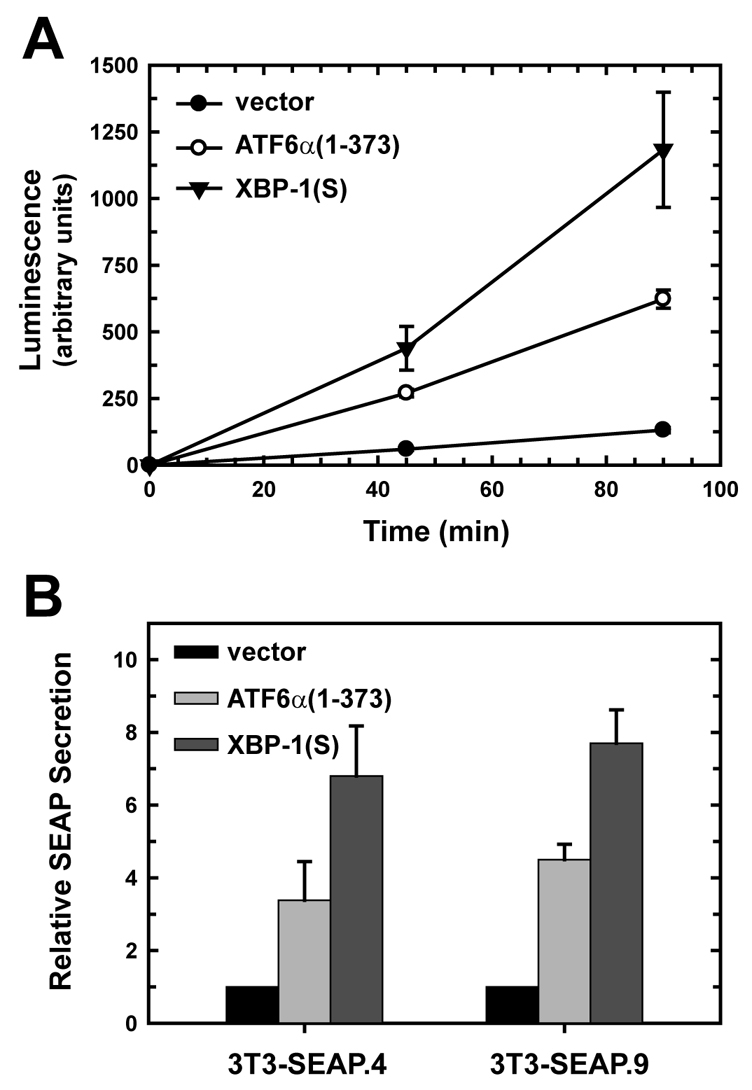
A link exists between endoplasmic reticulum (ER) biogenesis and the unfolded protein response (UPR), a complex set of signaling mechanisms triggered by increased demands on the protein folding capacity of the ER. The UPR transcriptional activator X-box binding protein 1 (XBP1) regulates the expression of proteins that function throughout the secretory pathway and is necessary for development of an expansive ER network. We previously demonstrated that overexpression of XBP1(S), the active form of XBP1 generated by UPR-mediated splicing of Xbp1 mRNA, augments the activity of the cytidine diphosphocholine (CDP-choline) pathway for biosynthesis of phosphatidylcholine (PtdCho) and induces ER biogenesis. Another UPR transcriptional activator, activating transcription factor 6alpha (ATF6alpha), primarily regulates expression of ER resident proteins involved in the maturation and degradation of ER client proteins. Here, we demonstrate that enforced expression of a constitutively active form of ATF6alpha drives ER expansion and can do so in the absence of XBP1(S). Overexpression of active ATF6alpha induces PtdCho biosynthesis and modulates the CDP-choline pathway differently than does enforced expression of XBP1(S). These data indicate that ATF6alpha and XBP1(S) have the ability to regulate lipid biosynthesis and ER expansion by mechanisms that are at least partially distinct. These studies reveal further complexity in the potential relationships between UPR pathways, lipid production and ER biogenesis.


Figures

Fig. 1.
Fig. 1.
Expression of HA-tagged UPR transcription factors in CHO cells. (A) CHO cells were transiently transfected with a vector expressing EGFP alone or vectors expressing EGFP and HA-tagged ATF6α(1-373), ATF6α(1-373)m1, ATF6β(1-393), XBP1(S) or ATF4. At 40 hours post-transfection, cells were fixed, stained with anti-HA monoclonal antibody and DAPI, and examined by fluorescence microscopy. (a) EGFP visualized with a FITC filter; (b) HA-tagged proteins visualized with a TRITC filter; (c) nuclei of cells stained with DAPI; (d) merged FITC, TRITC and DAPI images. Scale bars: 20 μm. (B) CHO cells were co-transfected with a reporter plasmid containing the firefly luciferase gene under the control of 5×ATF6 binding sites, a plasmid containing a lacZ gene under control of the CMV promoter and increasing amounts of the expression vectors as indicated. The total amount of expression vector DNA was maintained at a constant level by adding vector control DNA as necessary. At 40 hours post-transfection, cells were harvested and the relative ratio of firefly luciferase to β-galactosidase activity in each cell lysate was determined. The mean ± s.d. of three independent experiments is plotted.
Fig. 2.
Fig. 2.
Immunoblot analysis of FACS-isolated CHO cells expressing HA-tagged UPR transcription factors. CHO cells were transfected with the indicated expression vectors. At 40 hours post-transfection, EGFP+ cells were collected by FACS. Cell lysates were prepared and analyzed by immunoblotting using antibodies against (A) the HA epitope and EGFP proteins, (B) actin, ATF6α, ATF6β and XBP1(S) proteins, (C) the KDEL sequence (GRP94 and GRP78) and the CHOP, calnexin (CNX), calreticulin (CRT), ERp72, protein disulfide isomerase (PDI), ribophorin, TRAPα and SEC61β proteins. The same lysates were used for all immunoblots.
Fig. 3.
Fig. 3.
Electron microscopy analysis of the ER in CHO cells expressing HA-tagged UPR-transcription factors. CHO cells were transfected with the indicated expression vectors. At 40 hours post-transfection, EGFP+ cells were collected by FACS and then examined by TEM. (A) Vector alone- or ATF6α(1-373)-expressing cells at 4600× (left) and 25,000× (right). (B) ATF6α(1-373)m1-, ATF6β(1-393)-, XBP1(S)- and ATF4-expressing cells at 25000×. Arrows point to representative ER. For ATF6α(1-373), 19/20 cells examined by TEM exhibited ER expansion; for vector alone, ATF6α(1-373)m1, ATF6β(1-393) and ATF4, 0/20 cells and for XBP1(S), 0/50 cells, examined by EM exhibited ER expansion. Scale bars: 2 μm in 4600× frames and 500 nm in 25000× frames.
Fig. 4.
Fig. 4.
Analysis of XBP1 in ATF6α(1-373)-induced ER expansion. (A) CHO cells were transfected with the indicated expression vectors. At 40 hours post-transfection, EGFP+ cells were collected by FACS. As controls, CHO cells were left untreated (–) or treated with tunicamycin (Tm) for 6 hours and harvested. Total RNA was isolated and equivalent amounts of RNA (200 ng) from each sample were analyzed by RT-PCR using a primer set that amplifies hamster Xbp1 mRNA. Unspliced (Un) and UPR-spliced (S) Xbp1 transcripts yield 306 bp and 279 bp PCR products, respectively. (B) Xbp1–/– MEFs were nucleofected with the indicated expression vectors. At 40 hours post-transfection, EGFP+ cells were collected by FACS and then examined by TEM at the indicated magnifications. Arrows point to representative ER. For vector alone, 2/20 cells, and for ATF6α(1-373), 18/20 cells, examined by TEM exhibited ER expansion. Scale bars: 2 μm in 7900× frames and 500 nm in 19,000× frames.
Fig. 5.
Fig. 5.
Analysis of lipid abundance and lipid biosynthesis in NIH-3T3 cells transduced with ATF6α(1-373). (A) NIH-3T3 cells were transduced with empty vector (black bars) or ATF6α(1-373) (gray bars) retroviruses and assessed at 48 hours post-transduction. Total amounts of phosphatidylcholine (PtdCho), phosphatidylethanolamine (PtdEtn), cholesterol (Chol), sphingolipid (Sphing) and cholesterol ester (Chol ester) were determined by flame ionization and normalized to total cellular protein. The results are the mean ± s.d. of triplicate determinations and are representative of two independent experiments. (B,C) NIH-3T3 cells were transduced with the indicated retroviruses. At 48 hours post-transduction, cells were metabolically labeled with [14C]acetate for 2 hours. The incorporation of radiolabel into total fatty acids (B) and PtdCho (C) was determined as described in Materials and Methods and normalized to 107 cells. The data are the mean ± s.d. of triplicate determinations and are representative of two independent experiments.
Fig. 6.
Fig. 6.
Enzymatic activities in the CDP-choline pathway of PtdCho synthesis in NIH-3T3 fibroblasts transduced with ATF6α(1-373). The relative enzymatic activities of CK, CCT and CPT were determined using lysates or microsomes prepared from NIH-3T3 cells harvested 48 hours post-transduction with empty vector (black circle) and ATF6α(1-373) (white circle) retroviruses. The rates of production of phosphocholine, CDP-choline and PtdCho were compared as a function of total protein in each assay and are plotted as the mean ± s.d. obtained for each protein concentration. (A) Data for CK are averaged from quadruplicate determinations and are representative of two independent experiments. (B) Data for CCT are averaged from six determinations obtained in two independent experiments. (C) Data for CPT are averaged from triplicate determinations and are representative of two independent experiments.
Fig. 7.
Fig. 7.
Expression of CDP-choline pathway enzymes in NIH-3T3 fibroblasts transduced with ATF6α(1-373). NIH-3T3 cells were transduced with empty vector (black bars) or ATF6α(1-373) (gray bars) retroviruses and harvested at 48 hours post-transduction. Total RNA was prepared and the relative levels of expression of the CK α and β isoforms (Chkα and Chkβ), the CCT isoforms α, β2 and β3, and Chpt1 and Cept1 were measured by quantitative real-time PCR using gene-specific primers and probes. The amount of target RNA was normalized to endogenous Gapdh as a reference. The mean ± s.e.m. of triplicate determinations is plotted and is representative of two independent experiments.
Fig. 8.
Fig. 8.
Effect of ATF6α(1-373) and XBP1(S) on the secretory activity of NIH-3T3 fibroblasts. (A) NIH-3T3 cells stably expressing secreted alkaline phosphatase (SEAP) were transduced with empty vector (black circle), ATF6α(1-373) (white circle) and XBP1(S) (triangle) retroviruses. At 48 hours post-transduction, cells were washed, shifted into fresh media and then cultured for 45 or 90 minutes. Culture supernatants harvested at each time were assessed for SEAP activity using a chemiluminescence assay, and luminescence readings were normalized to cell number. The mean ± s.d. of triplicate determinations is plotted and is representative of five independent experiments. (B) Two separate clones of SEAP-expressing NIH-3T3 cells (3T3-SEAP.4 and 3T3-SEAP.9) were transduced with empty vector (black bars), ATF6α(1-373) (light-gray bars) or XBP1(S) (dark-gray bars) retroviruses. SEAP secretion was assessed 48 hours post-transduction as described in A and calculated as the level relative to SEAP secretion by empty vector-transduced cells (set at 1). The mean ± s.d. is plotted (3T3-SEAP.4, n=3; 3T3-SEAP.9, n=2).

Similar articles

Cited by

References

    1. Adachi, Y., Yamamoto, K., Okada, T., Yoshida, H., Harada, A. and Mori, K. (2008). ATF6 is a transcription factor specializing in the regulation of quality control proteins in the endoplasmic reticulum. Cell Struct. Funct. 33, 75-89. - PubMed
    1. Back, S. H., Lee, K., Vink, E. and Kaufman, R. J. (2006). Cytoplasmic IRE1alpha-mediated XBP1 mRNA splicing in the absence of nuclear processing and endoplasmic reticulum stress. J. Biol. Chem. 281, 18691-18706. - PubMed
    1. Calfon, M., Zeng, H., Urano, F., Till, J. H., Hubbard, S. R., Harding, H. P., Clark, S. G. and Ron, D. (2002). IRE1 couples endoplasmic reticulum load to secretory capacity by processing the XBP-1 mRNA. Nature 415, 92-96. - PubMed
    1. Fagone, P., Sriburi, R., Ward-Chapman, C., Frank, M., Wang, J., Gunter, C., Brewer, J. W. and Jackowski, S. (2007). Phospholipid biosynthesis program underlying membrane expansion during B-lymphocyte differentiation. J. Biol. Chem. 282, 7591-7605. - PubMed
    1. Gass, J. N., Gifford, N. M. and Brewer, J. W. (2002). Activation of an unfolded protein response during differentiation of antibody-secreting B cells. J. Biol. Chem. 277, 49047-49054. - PubMed

Publication types

MeSH terms