. 2009 May 6;29(18):5806-19.
doi: 10.1523/JNEUROSCI.1106-09.2009.

Photostimulation of retrotrapezoid nucleus phox2b-expressing neurons in vivo produces long-lasting activation of breathing in rats

Affiliations

Photostimulation of retrotrapezoid nucleus phox2b-expressing neurons in vivo produces long-lasting activation of breathing in rats

Stephen B G Abbott et al. J Neurosci. .

Abstract

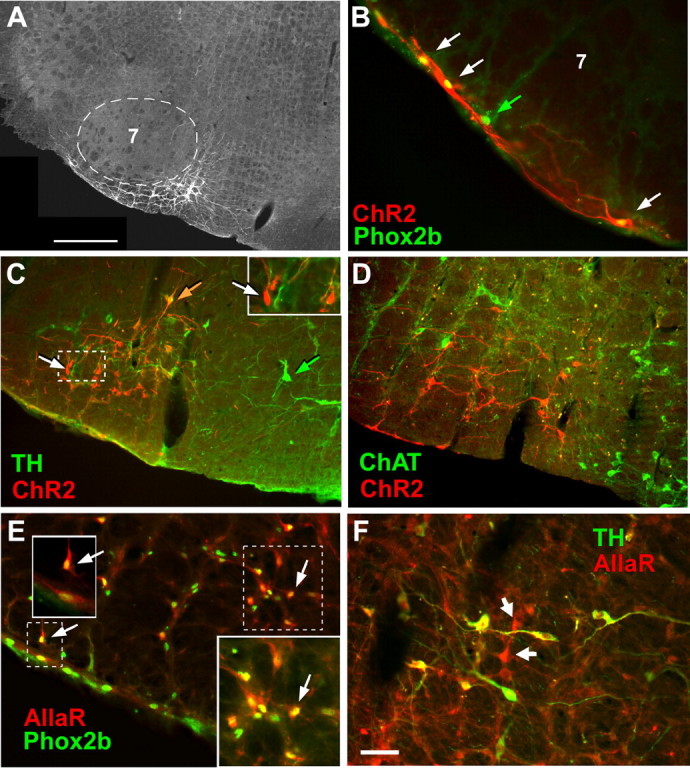
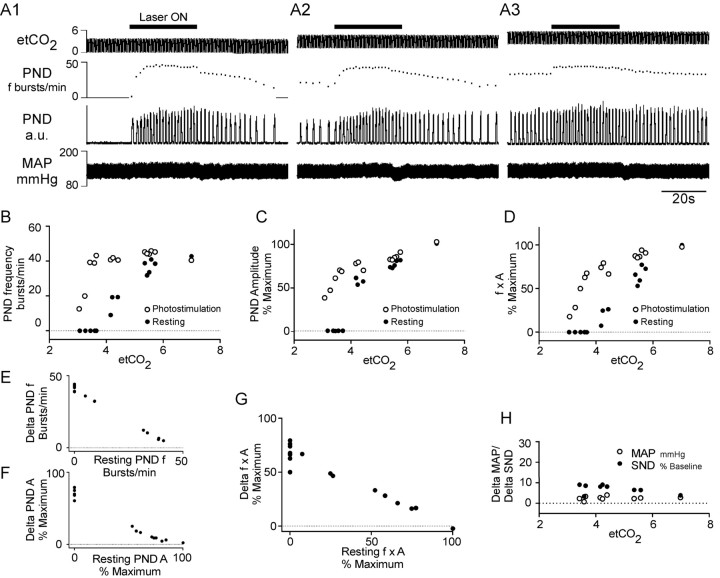
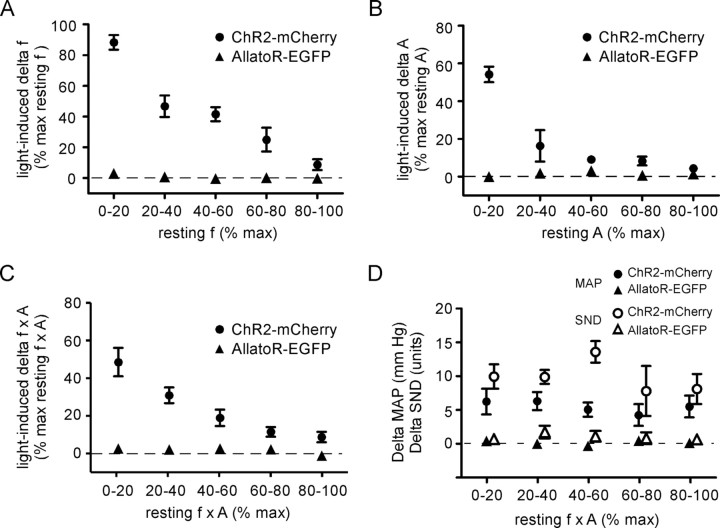
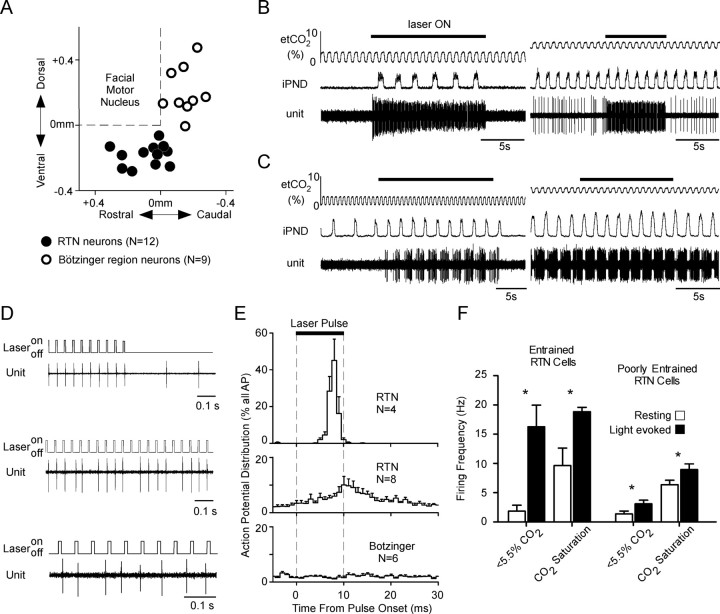
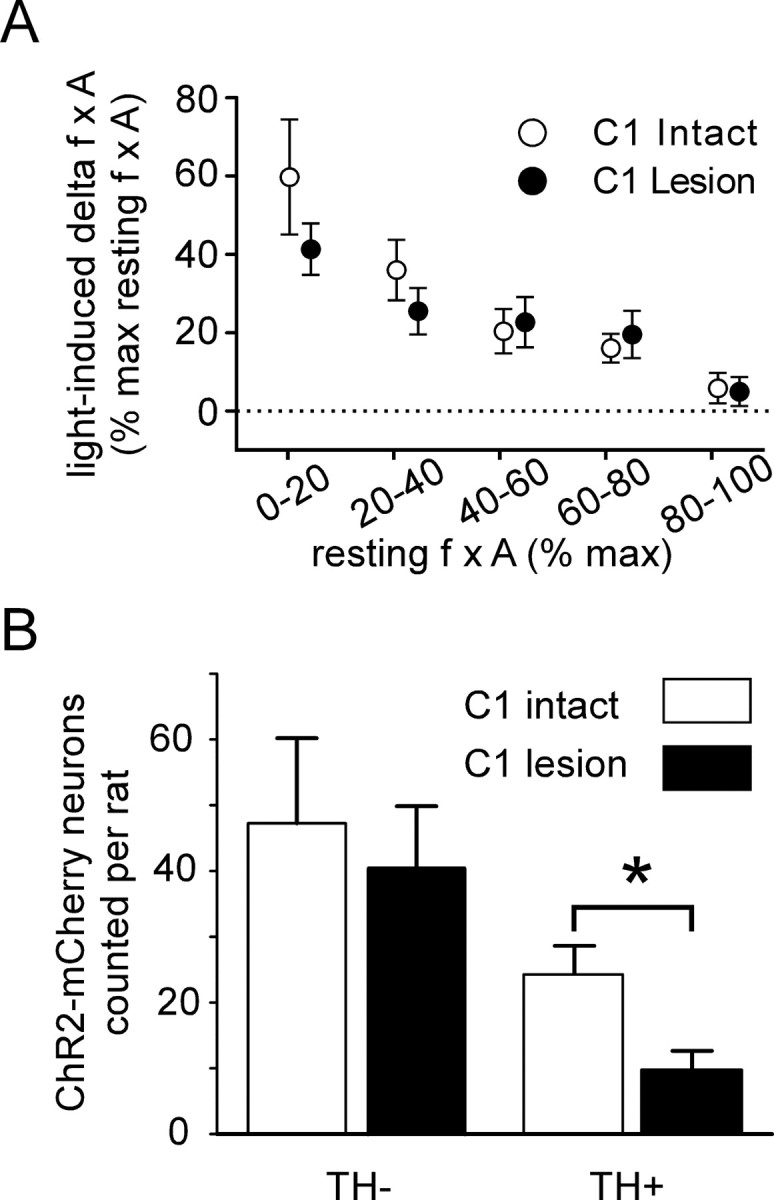
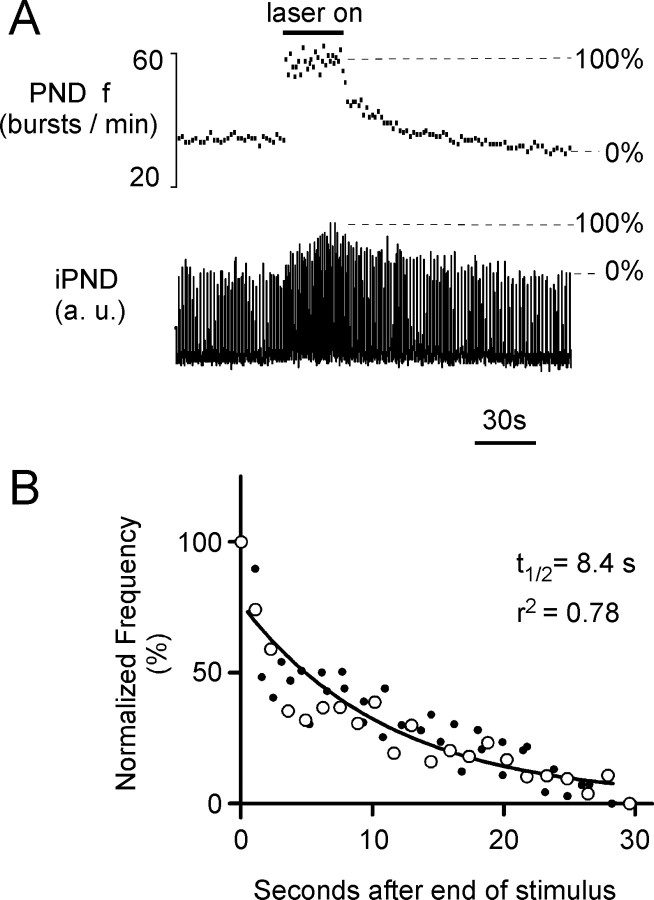
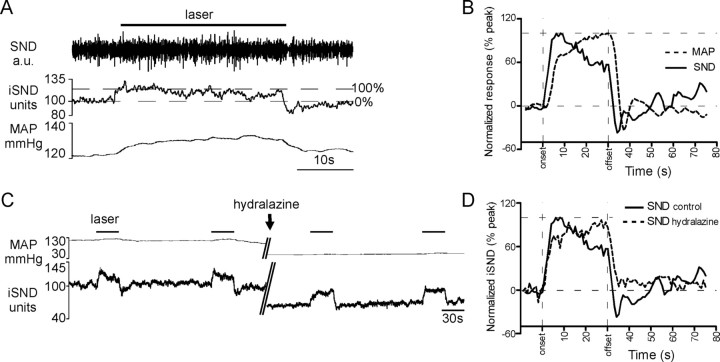
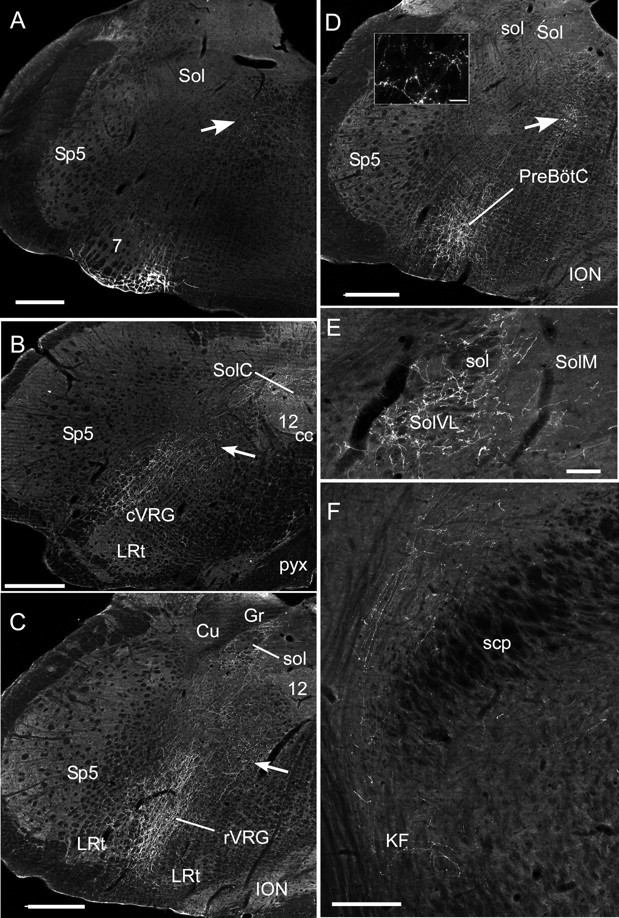
The retrotrapezoid "nucleus" (RTN), located in the rostral ventrolateral medullary reticular formation, contains a bilateral cluster of approximately 1000 glutamatergic noncatecholaminergic Phox2b-expressing propriobulbar neurons that are activated by CO(2) in vivo and by acidification in vitro. These cells are thought to function as central respiratory chemoreceptors, but this theory still lacks a crucial piece of evidence, namely that stimulating these particular neurons selectively in vivo increases breathing. The present study performed in anesthetized rats seeks to test whether this expectation is correct. We injected into the left RTN a lentivirus that expresses the light-activated cationic channel ChR2 (channelrhodopsin-2) (H134R mutation; fused to the fluorescent protein mCherry) under the control of the Phox2-responsive promoter PRSx8. Transgene expression was restricted to 423 +/- 38 Phox2b-expressing neurons per rat consisting of noncatecholaminergic and C1 adrenergic neurons (3:2 ratio). Photostimulation delivered to the RTN region in vivo via a fiberoptic activated the CO(2)-sensitive neurons vigorously, produced a long-lasting (t(1/2) = 11 s) increase in phrenic nerve activity, and caused a small and short-lasting cardiovascular stimulation. Selective lesions of the C1 cells eliminated the cardiovascular response but left the respiratory stimulation intact. In rats with C1 cell lesions, the mCherry-labeled axon terminals originating from the transfected noncatecholaminergic neurons were present exclusively in the lower brainstem regions that contain the respiratory pattern generator. These results provide strong evidence that the Phox2b-expressing noncatecholaminergic neurons of the RTN region function as central respiratory chemoreceptors.


Figures

Figure 1.
Figure 1.
Transgene expression by noncatecholaminergic and catecholaminergic neurons after injection of PRSx8-ChR2-mCherry or PRSx8-AllatoR-IRES-EGFP lentivirus into region of the retrotrapezoid nucleus. A, Transverse section showing an injection site in the RTN. Fluorescent neurons expressing ChR2-mCherry are located exclusively medial and ventral to the facial motor nucleus (7; dotted line). In this and all other panels, medial is toward the right, lateral is left, and dorsal is up. Scale bar, 500 μm. B, ChR2-mCherry-expressing neurons located under the facial motor nucleus along the ventral medullary surface. Three neurons expressing the ChR2-mCherry transgene (red fluorescence; white arrows) have Phox2b-ir nuclei (green fluorescence appears yellow in mCherry-positive neurons). The neuron identified with a green arrow has a Phox2b-ir nucleus but was not transfected with virus. C, Neurons that express ChR2-mCherry are both catecholaminergic (TH-ir) and noncatecholaminergic. TH immunoreactivity is in green, and mCherry is red. Double-labeled neurons appear orange. One example is shown by the orange arrow. mCherry-expressing noncatecholaminergic neurons appear red (e.g., white arrows in the main photograph and the inset). Untransfected TH-ir neurons (located medially, toward the right side) show only green fluorescence (e.g., green arrow). D, Neurons expressing the ChR2-mCherry transgene are not cholinergic. The neurons expressing the mCherry fusion protein are in red, whereas the choline acetyltransferase (ChAT)-ir neurons are in green. Note that there are no double-labeled neurons. E, Neurons expressing the AllatoR-IRES-eGFP transgene (AllaR, revealed by GFP immunoreactivity, is visualized with red fluorescence) are Phox2b-ir (yellow or yellow-green fluorescent nuclei). The arrows point to a few examples. The insets are higher magnification of dashed outlines. F, Neurons expressing the AllatoR-IRES-eGFP transgene are a mixture of catecholaminergic C1 neurons (TH-ir) (double-labeled neurons appear yellow, a combination of green and red fluorescence) and noncatecholaminergic neurons (red fluorescence only; white arrows). Scale bar: (in F) B, E, F, 50 μm; C, D, 100 μm.
Figure 2.
Figure 2.
Distribution and quantification of neurons expressing the ChR2-mCherry transgene. A, Distribution of C1 (ChR2+TH+, yellow squares) and noncatecholaminergic neurons (ChR2+TH−, red circles) expressing ChR2-mCherry in a representative rat (neuronal nuclear profiles counted in a 1-in-6 series of 30-μm-thick transverse sections through the injection site). Nontransfected C1 neurons (ChR2−TH+, blue triangles) are also represented. Each symbol represents one cell. The numbers in the top left corner of each section refer to the distance of the section behind bregma in millimeters [after the atlas of Paxinos and Watson (2005)]. By our convention, 11.6 mm is designated as the first section in which the facial motor neurons appear from a caudal approach, and the rest of the sections are placed relative to this landmark. Brain reconstructions were made using the Neurolucida software (MBFBioscience) and a Zeiss Axioskop II microscope with epifluorescence using filter sets for Cy3 and Alexa 488 fluorophores. Note the vertical lesion caused by the placement of the fiber optic in the section corresponding to bregma level 11.42. B, Group data. Two of the plots show the rostrocaudal distribution of noncatecholaminergic (TH−, red circles, red line) and catecholaminergic (TH+, yellow squares, black line) neurons that expressed mCherry after injection of PRSX8-ChR2-mCherry virus into the RTN region (mean ± SEM; 7 rats). The remaining plot shows the distribution of all the neurons (TH+ and TH−) that expressed eGFP after injection of PRSX8-Allatostatin receptor-IRES-eGFP virus into the RTN region (black circles, dashed line; 5 rats). C, Total number of counted catecholaminergic (TH+) and noncatecholaminergic neurons expressing the transgene after injection of PRSX8-ChR2-mCherry lentivirus (7 rats; cell counts in black bars) or PRSX8-AllatoR-IRES-EGFP lentivirus (5 rats; cell counts of EGFP-ir in gray bars) into the RTN region (mean ± SEM). Cell counts were made in each rat in a one-in-six series of 30 μm sections as in A. Accordingly, the estimated total number of transfected neurons is approximately six times that reported on the graph.
Figure 3.
Figure 3.
Cardiorespiratory effects produced by photostimulation of ChR2-expressing RTN neurons in one rat. A, Pulsed laser light (473 nm; 10 ms, 20 Hz) was applied for 30 s every 2 min to the ventrolateral medulla through a 200-μm-thick fiber optic while the end-tidal CO2 (etCO2) (top trace) was set at various levels. Shown are the effects of the photostimulation (laser ON; horizontal bars) on phrenic nerve discharge frequency (PND; second trace from top), PND amplitude (rectified and integrated with 0.015 s time constant; third trace from top), and arterial pressure (AP) (fourth trace). Episode A1 was recorded while etCO2 was below the apneic threshold, episode A2 while etCO2 was just above the apneic threshold, and episode A3 while etCO2 was close to the saturation of the central chemoreflex. B, Relationship between the respiratory frequency and etCO2. C, Relationship between PND amplitude and etCO2. D, Relationship between the total respiratory outflow (f × A, product of PND amplitude and PND frequency, normalized to 100%) and etCO2. Each pair of vertically aligned symbols (a dot and a circle) derives from one episode of photostimulation such as shown in A1–A3. E, Relationship between the photoactivated increase in respiratory frequency and the respiratory frequency at rest. The graph is derived from the data shown in B. F, Relationship between the photoactivated increase in the amplitude of the PND and the PND amplitude at rest. The graph is derived from the data shown in C. G, Relationship between the respiratory response caused by each period of photostimulation (increase of the f × A product) and the resting level of respiratory activity (f × A). The graph is derived from the data shown in D. H, Changes in MAP and SND plotted as a function of etCO2. All panels are from the same rat.
Figure 4.
Figure 4.
Cardiorespiratory effects produced by photostimulation of the ventrolateral medulla: group data. Effects produced by applying blue laser light (473 nm; 10 ms, 20 Hz) to the ventrolateral medulla in nine rats treated with PRSx8-ChR2mCherry-lentivirus (pooled data of 5 isoflurane-anesthetized rats and 4 urethane-anesthetized rats) and five control rats treated with PRSx8-allatoR-EGFP-lentivirus. A, Plot of the increase in respiratory frequency as a function of the resting phrenic nerve discharge. PND frequency was regrouped by quintiles and normalized to the maximum frequency observed at saturation of the chemoreflex. B, Plot of the increase in respiratory amplitude as a function of the resting phrenic nerve amplitude regrouped by quintiles and normalized to the maximum amplitude observed at saturation of the chemoreflex. C, Plot of the increase in total phrenic outflow (f × A) as a function of the resting PND also regrouped by quintiles and normalized to the maximum value observed at saturation of the chemoreflex. The difference between the control rats and the experimental rats was highly significant for all three dependent variables (see text for statistics). D, Effect of photostimulation on the MAP and on the SND plotted as a function of the total phrenic nerve activity f × A divided in quintiles as in A–C. The difference between the rats treated with the experimental virus (ChR2) and the control virus was highly significant (see text for statistics). Error bars indicate SEM.
Figure 5.
Figure 5.
Photoactivation of the CO2-responsive RTN neurons. A, Location of 12 CO2-activated neurons located in the RTN and 9 control respiratory cells located in the Bötzinger region of the ventral respiratory column. The location of the cells is plotted using their stereotaxic coordinates relative to the base and the caudal edge of the facial motor nucleus as determined by antidromic field potentials. The base of the brain is between 0.3 and 0.4 mm below the facial motor nucleus. B, Effect of a train of laser pulses (473 nm; 10 ms, 20 Hz) on a CO2-responsive RTN neuron recorded at low (left trace) and high level of end-tidal CO2 (right trace). C, Activation of a Bötzinger expiratory-augmenting neuron by photostimulation applied to the RTN region at low (left trace) and at high level of end-tidal CO2 (right trace). D, Top traces, Examples of two RTN neurons that were presumably directly photoactivated via ChR2. These cells fired a single action potential toward the end of almost every light pulse. Bottom trace, Bötzinger respiratory neuron, shown in C, which was presumably indirectly (i.e., synaptically) activated by the photostimulation of the RTN. The action potentials of this neuron were not synchronized with the light pulses. E, Probability histogram showing the distribution of action potentials occurring from 5 ms before the light pulses to 20 ms after the end of the light pulses. The histograms were built using the onset of the light pulses as trigger. The top trace describes four RTN neurons that were strongly synchronized with the light pulses; the middle trace describes the remaining eight RTN neurons. The bottom histogram represents six Bötzinger area respiratory neurons activated during photostimulation. F, Average discharge frequency of the RTN neurons at rest and during photostimulation. The four RTN neurons that were vigorously entrained by the photostimulation on a pulse-by-pulse basis are represented separately from the rest of the RTN neurons. The effect of photostimulation on the neuronal firing rate at low and high levels of end-expiratory CO2 are also represented. Error bars indicate SEM. Asterisks indicate statistically significant difference from resting (paired t test).
Figure 6.
Figure 6.
Cardiorespiratory effects produced by stimulating ChR2-expressing neurons in control rats versus rats with C1 cell lesions. A, Plot of the respiratory response (increase in f × A) to photostimulation as a function of the resting value of f × A. The f × A product was normalized as in Figures 3G and 4C, the 100% value representing the highest value observed at saturation of the chemoreflex. The respiratory response produced in control rats and in rats with lesions of the C1 neurons was the same (ns, two-way ANOVA). B, Total number of ChR2-mCherry-positive neurons counted in control and C1 lesion rats in a one-in six series of sections (actual numbers of neurons labeled per rat should be ∼6 times larger). The number of catecholaminergic neurons (TH-ir) that expressed the transgene was greatly reduced in the C1 lesion rats (p < 0.05 by unpaired t test), whereas the number of TH-negative neurons (RTN neurons) was the same (ns, unpaired t test). Error bars indicate SEM. The asterisk indicates statistically significant difference.
Figure 7.
Figure 7.
Persistence of the respiratory response elicited by photostimulation of the ChR2-expressing neurons. A, Representative respiratory response to photostimulation of the RTN region in a urethane-anesthetized rat (473 nm, 20 Hz, 10 ms light pulses; transcerebellar optical fiber method). The drawing illustrates how the increase in PND amplitude and frequency were normalized. B, Relaxation of the frequency response after the end of the photostimulation period. The change in PND frequency is normalized as shown in A. The episode shown in A is represented by the open circles. The other episodes of photostimulation in the same animal are represented by small dots. The curve is the best single-exponential fit through all the points.
Figure 8.
Figure 8.
Kinetic properties of the sympathetic nerve response produced by photostimulation of the ChR2-expressing neurons. A, Representative cardiovascular response to a 30 s exposure of the RTN region to 473 nm, 20 Hz, 10 ms light pulses (transcerebellar optical fiber method). Top trace, Raw splanchnic sympathetic nerve discharge; middle trace, iSND (for units and calibration, see Materials and Methods); bottom trace, mean femoral arterial pressure (MAP). The drawing illustrates how the increase in SND amplitude was normalized across photostimulation episodes and rats. B, Averaged normalized cardiovascular responses to blue light photostimulation (SND and BP) before administration of the arteriolar vasodilator hydralazine. To generate these curves, a single curve was generated per rat by averaging up to six individual normalized responses using the onset of the photostimulation as a trigger. In a second step, the resulting curves were averaged across the five rats to produce the grand averages shown in this panel. C, Sympathetic nerve response before and after lowering BP with an intravenous injection of the vasodilator hydralazine (given at arrow during the 5 min break in the record) to eliminate the influence of the baroreflex on SND. D, Averaged normalized sympathetic nerve response to photostimulation before and after administration of hydralazine. In the presence of this agent, SND was maintained or further increased during the course of the stimulus indicating the absence of a baroreflex. The absence of the baroreflex also accounts for the loss of the undershoot present immediately after the end of the stimulus in the absence of hydralazine. In the presence of hydralazine, SND recovered to the baseline level within a few seconds after the end of the photostimulation.
Figure 9.
Figure 9.
Anatomical projections of the RTN neurons. A, Injection site of PRSX8-ChR2-mCherry lentivirus in the ventrolateral medulla in a rat treated by anti-DBH-saporin to reduce the number of TH neurons that reside in the RTN region. Note that mCherry fluorescence is confined to neurons located just ventral and medial to the facial motor nucleus (7). The arrows in A–D point to transversely cut axons emanating from the labeled neurons. Sp5, Spinal trigeminal nucleus; Sol, nucleus of the solitary tract. Scale bar: A–D, 500 μm. B, Projections to the caudal medulla are confined to the cVRG (caudal ventral respiratory group), the nucleus of the solitary tract, and the region between these areas. 12, Hypoglossal nucleus; cc, central canal; LRt, lateral reticular nucleus; pyx, decussation of the pyramidal tract; SolC, commissural subnucleus of the solitary tract nucleus. Other abbreviations are as in A. C, Projection to the rostral ventral respiratory group (rVRG). Cu, Cuneate nucleus; Gr, gracile nucleus; ION, inferior olivary nucleus; sol, solitary tract. Other abbreviations are as in A and B. The lateral portion of the nucleus of the solitary tract is also heavily innervated. D, Heavy projections to the Pre-Bötzinger complex (PreBötC). The inset illustrates labeled boutons observed in the PreBötC. Scale bar: inset, 25 μm. Abbreviations are as above. E, Projections to the caudal portion of the solitary tract nucleus. Note that most of the boutons are in the interstitial and ventrolateral portions of the nucleus (SolVL) in which respiratory-related neurons reside. Scale bar, 100 μm. SolM, Medial subnucleus of Sol. Other abbreviations are as above. F, Projections to the parabrachial nucleus and Kölliker–Fuse (KF) nucleus. scp, Superior cerebellar peduncle. Scale bar, 250 μm.

References

    1. Adamantidis AR, Zhang F, Aravanis AM, Deisseroth K, de Lecea L. Neural substrates of awakening probed with optogenetic control of hypocretin neurons. Nature. 2007;450:420–424. - PMC - PubMed
    1. Alheid GF, McCrimmon DR. The chemical neuroanatomy of breathing. Respir Physiol Neurobiol. 2008;164:3–11. - PMC - PubMed
    1. Arenkiel BR, Peca J, Davison IG, Feliciano C, Deisseroth K, Augustine GJ, Ehlers MD, Feng G. In vivo light-induced activation of neural circuitry in transgenic mice expressing channelrhodopsin-2. Neuron. 2007;54:205–218. - PMC - PubMed
    1. Bainton CR, Kirkwood PA. The effect of carbon dioxide on the tonic and the rhythmic discharges of expiratory bulbospinal neurones. J Physiol. 1979;296:291–314. - PMC - PubMed
    1. Boyden ES, Zhang F, Bamberg E, Nagel G, Deisseroth K. Millisecond-timescale, genetically targeted optical control of neural activity. Nat Neurosci. 2005;8:1263–1268. - PubMed

Publication types

MeSH terms