Clinical Trial
. 2009 May 6;29(18):6042-51.
doi: 10.1523/JNEUROSCI.5548-08.2009.

Massage accelerates brain development and the maturation of visual function

Affiliations
Clinical Trial

Massage accelerates brain development and the maturation of visual function

Andrea Guzzetta et al. J Neurosci. .

Abstract

Environmental enrichment (EE) was shown recently to accelerate brain development in rodents. Increased levels of maternal care, and particularly tactile stimulation through licking and grooming, may represent a key component in the early phases of EE. We hypothesized that enriching the environment in terms of body massage may thus accelerate brain development in infants. We explored the effects of body massage in preterm infants and found that massage accelerates the maturation of electroencephalographic activity and of visual function, in particular visual acuity. In massaged infants, we found higher levels of blood IGF-1. Massage accelerated the maturation of visual function also in rat pups and increased the level of IGF-1 in the cortex. Antagonizing IGF-1 action by means of systemic injections of the IGF-1 antagonist JB1 blocked the effects of massage in rat pups. These results demonstrate that massage has an influence on brain development and in particular on visual development and suggest that its effects are mediated by specific endogenous factors such as IGF-1.


Figures

Figure 1.
Figure 1.
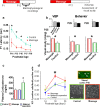
a, Difference between premassage and postmassage assessment of maximum interburst interval (EEG). Boxes indicate median (black horizontal line), interquartile values, and range. Massaged infants show larger differences between T2 and T1, which are statistically significant from those in controls (Mann–Whitney test, *p = 0.011). b, Difference between premassage and postmassage assessment of N300 latency (fVEP). Massaged infants show larger differences between T2 and T1, which are statistically significant from those in controls (Mann–Whitney test, *p = 0.013). c, Behavioral visual acuity measured in cycles per degree (c/deg) by means of the Vital-Durand Acuity Cards at 3 and 7 months corrected age. Bars indicate mean values and SEM. Visual acuity in massaged infants is significantly higher than in controls at 3 months (*p = 0.001, t test). This difference is no longer present at 7 months. Normal values for term-born infants are 3–5.2 c/° at 3 months and 6.8–8.8 at 6 months. d, Variation between premassage and postmassage assessment of blood IGF1, IGFBP3, and cortisol (T2 − T1/T1). Differences between the two experimental groups are significant for IGF-1, with massaged infants showing a smaller decrease between T1 and T2 (**p = 0.001), and for cortisol, with massaged infants showing a stronger decrease (*p = 0.029). No significant difference was found for IGFBP3 (p = 0.1).
Figure 2.
Figure 2.
a, Massage in rat pups determines a significantly faster rate of reduction in the latencies of the flash VEP. Top, Experimental protocol. Bottom, Mean P1 latency plotted as a function of age for the groups of massaged and of control rats. The developmental shortening of P1 latency is significantly faster for massaged rats than control rats (two-way ANOVA, treatment × age, factor age p < 0.001, factor treatment p < 0.001, n = 4 for each age group both for massaged and controls, Holm–Sidak post hoc test). Asterisks denote significant difference between treatments at a given postnatal day. Vertical bars represent SEM. b, Massage in rat pups affects visual acuity development. Top, Experimental protocol. Bottom left, Mean visual acuity determined at P25 by means of VEPs recorded from the primary visual cortex for massaged rats (n = 11) and for control rats (n = 7). Vertical bars are SEM. Massage group significantly differs from control group and from maternal separation group (n = 12; inset) (one-way ANOVA, factor treatment significant, p = 0.003, multiple comparison procedure Holm–Sidak method, visual acuity of massage rats differs from that of control rats and of maternal separation rats; the latter two do not differ). Bottom right, Mean behavioral visual acuity in P25 and P28 massage, controls, and maternal separation groups. Vertical bars represent SEM. Visual acuity of massaged rats (n = 15) is significantly higher than in control (n = 13) or in maternal separation (n = 11; inset) (two-way repeated measures ANOVA, treatment × age, factor age significant, p < 0.001, factor treatment significant, p < 0.001, visual acuity in massage group different from controls and maternal separation groups at both ages, p < 0.05; visual acuity in controls and maternal separation group not significantly different, multiple comparison procedure Holm–Sidak method). Asterisks denote significant difference. c/deg, c/°. c, Mean plasma corticosterone levels at P14 in massage, maternal separation, and control groups. The level of corticosterone in the control groups is significantly higher than in the maternal separation and massage groups (one-way ANOVA, p < 0.02, n = 6 for each group, post hoc Tukey's test). Vertical bars denote SEM. Asterisks denote significant difference. d, Left, Mean number of IGF-1-positive cells in the visual cortex, normalized to the number of neurons (NeuN-positive cells) for each developmental age analyzed. n = 4 for each age and each experimental group. Vertical bars represent SEM. The normalized number of IGF-1-positive cells increases significantly between P15 and P18; the normalized number at P18 in massaged rats is significantly increased with respect to maternal separation and control rats (two-way ANOVA, treatment × age, factor treatment p = 0.024, factor age p < 0.01, post hoc Tukey's test). Top right, Typical appearance of IGF-1-positive cells in the developing rat binocular visual cortex (P25). Scale bar, 25 μm. Bottom right, Examples of IGF-1 labeling at P18 for one massaged and one control rat. Scale bar, 50 μm.

References

    1. Als H, Lawhon G, Duffy FH, McAnulty GB, Gibes-Grossman R, Blickman JG. Individualized developmental care for the very low-birth-weight preterm infant: medical and neurofunctional effects. JAMA. 1994;272:853–858. - PubMed
    1. Biagioni E, Bartalena L, Boldrini A, Cioni G, Giancola S, Ipata AE. Background EEG activity in preterm infants: correlation of outcome with selected maturational features. Electroencephalogr Clin Neurophysiol. 1994;91:154–162. - PubMed
    1. Biagioni E, Bartalena L, Biver P, Pieri R, Cioni G. Electroencephalographic dysmaturity in preterm infants: a prognostic tool in the early postnatal period. Neuropediatrics. 1996;27:311–316. - PubMed
    1. Burton CL, Chatterjee D, Chatterjee-Chakraborty M, Lovic V, Grella SL, Steiner M, Fleming AS. Prenatal restraint stress and motherless rearing disrupts expression of plasticity markers and stress-induced corticosterone release in adult female Sprague-Dawley rats. Brain Res. 2007;1158:28–38. - PubMed
    1. Cancedda L, Putignano E, Sale A, Viegi A, Berardi N, Maffei L. Acceleration of visual system development by environmental enrichment. J Neurosci. 2004;24:4840–4848. - PMC - PubMed

Publication types

MeSH terms