. 2009;4(5):e5333.
doi: 10.1371/journal.pone.0005333. Epub 2009 May 6.

Fishery-independent data reveal negative effect of human population density on Caribbean predatory fish communities

Affiliations

Fishery-independent data reveal negative effect of human population density on Caribbean predatory fish communities

Christopher D Stallings. PLoS One. 2009.

Abstract

Background: Understanding the current status of predatory fish communities, and the effects fishing has on them, is vitally important information for management. However, data are often insufficient at region-wide scales to assess the effects of extraction in coral reef ecosystems of developing nations.

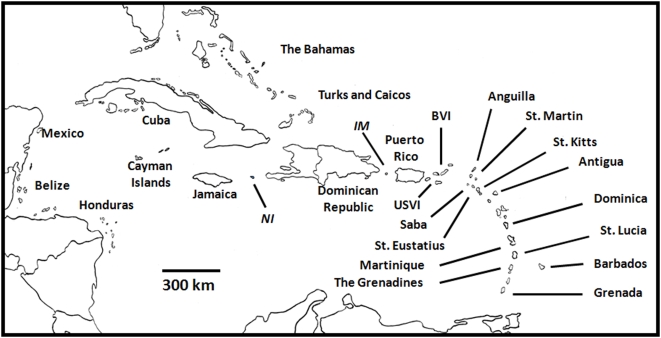
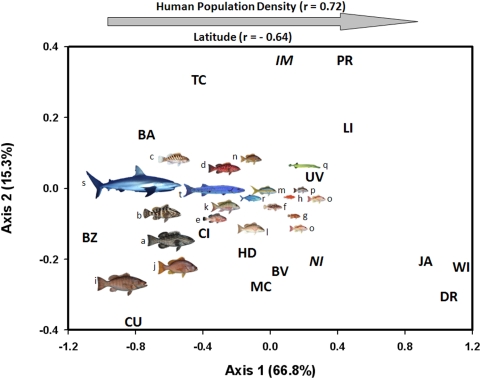
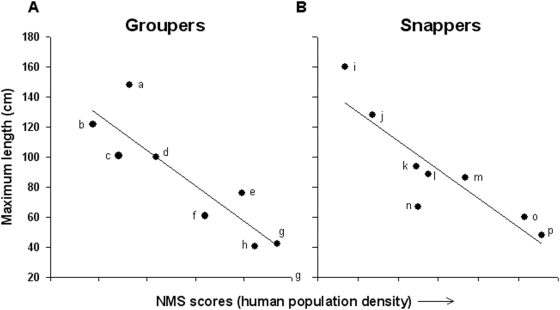
Methodology/principal findings: Here, I overcome this difficulty by using a publicly accessible, fisheries-independent database to provide a broad scale, comprehensive analysis of human impacts on predatory reef fish communities across the greater Caribbean region. Specifically, this study analyzed presence and diversity of predatory reef fishes over a gradient of human population density. Across the region, as human population density increases, presence of large-bodied fishes declines, and fish communities become dominated by a few smaller-bodied species.

Conclusions/significance: Complete disappearance of several large-bodied fishes indicates ecological and local extinctions have occurred in some densely populated areas. These findings fill a fundamentally important gap in our knowledge of the ecosystem effects of artisanal fisheries in developing nations, and provide support for multiple approaches to data collection where they are commonly unavailable.


Conflict of interest statement

Competing Interests: The author has declared that no competing interests exist.

Figures

Figure 1
Figure 1. Map of Caribbean locations from which predator presence data were gathered.
The data were from all locations in which at least 10 volunteer diver surveys were conducted between 1994 and 2008. The locations of the two uninhabited islands are italicized: IM (Isla de Mona); NI (Navassa Island).
Figure 2
Figure 2. NMS ordination of regions in predatory fish space (20 taxa).
Regional centroids are displayed: BA (Bahamas); TC (Turks and Caicos); CU (Cuba); CI (Cayman Islands); JA (Jamaica); MC (Mexican Caribbean); BZ (Belize); HD (Honduras); DR (Dominican Republic), PR (Puerto Rico); UV (US Virgin Islands); BV (British Virgin Islands); LI (Leeward Islands); WI (Windward Islands). The axis 1 scores for the two uninhabited islands are italicized: IM (Isla de Mona); NI (Navassa Island). Along axis 1, latitude increases towards the left and human population density increases towards the right. Taxa locations are represented with coded fish displays: a (Mycteroperca bonaci); b (Epinephelus striatus); c (M. tigris); d (M. venenosa); e (E. guttatus); f (E. adscensionis); g (Cephalopholis cruentata); h (C. fulva); I (Lutjanus cyanopterus); j (L. jocu); k (L. analis); l (L. griseus); m (Ocyurus chrysurus); n (L. apodus); o (L. synagris); p (L. mahogoni); q (Aulostomus maculatus); r (Caranx spp.); s (Carcharhinus spp.); t (Sphyraena barracuda). Fish displays are scaled according to maximum attainable sizes of each taxa.
Figure 3
Figure 3. Maximum lengths of serranids and lutjanids as a function of human population density.
Taxon codes are in caption to Figure 2. Regression statistics (n = 8 species each): (A) serranid maximum published lengths (r2 = 0.78, p = 0.004); (B) lutjanid maximum published lengths (r2 = 0.78, p = 0.003). NMS scores are from the axis that accounted for the most variation in the data. Axis variation explained and correlation with human population density: (A) serranid ordination (axis r2 = 0.55, r with axis = 0.75); (B) lutjanid ordination (axis r2 = 0.46, r with axis = 0.50).

References

    1. Christensen V, Guenette S, Heymans JJ, Walters CJ, Watson R, et al. Hundred-year decline of North Atlantic predatory fishes. Fish and Fisheries. 2003;4(1):1–24.
    1. Coleman FC, Figueira WF, Ueland JS, Crowder LB. The impact of United States recreational fisheries on marine fish populations. Science. 2004;305(5692):1958–1960. - PubMed
    1. Essington TE, Beaudreau AH, Wiedenmann J. Fishing through marine food webs. Proceedings of the National Academy of Sciences of the United States of America. 2006;103(9):3171–3175. - PMC - PubMed
    1. Myers RA, Worm B. Rapid worldwide depletion of predatory fish communities. Nature. 2003;423(6937):280–283. - PubMed
    1. Myers RA, Worm B. Extinction, survival or recovery of large predatory fishes. Philosophical Transactions of the Royal Society B-Biological Sciences. 2005;360(1453):13–20. - PMC - PubMed

Publication types