

The miR-106b-25 polycistron, activated by genomic amplification, functions as an oncogene by suppressing p21 and Bim
- PMID: 19422085
- PMCID: PMC2887605
- DOI: 10.1053/j.gastro.2009.02.002
The miR-106b-25 polycistron, activated by genomic amplification, functions as an oncogene by suppressing p21 and Bim
Abstract
Background & aims: Barrett's esophagus (BE) is a highly premalignant disease that predisposes to the development of esophageal adenocarcinoma (EAC); however, the involvement of microRNAs (miRs) in BE-EAC carcinogenic progression is not known.
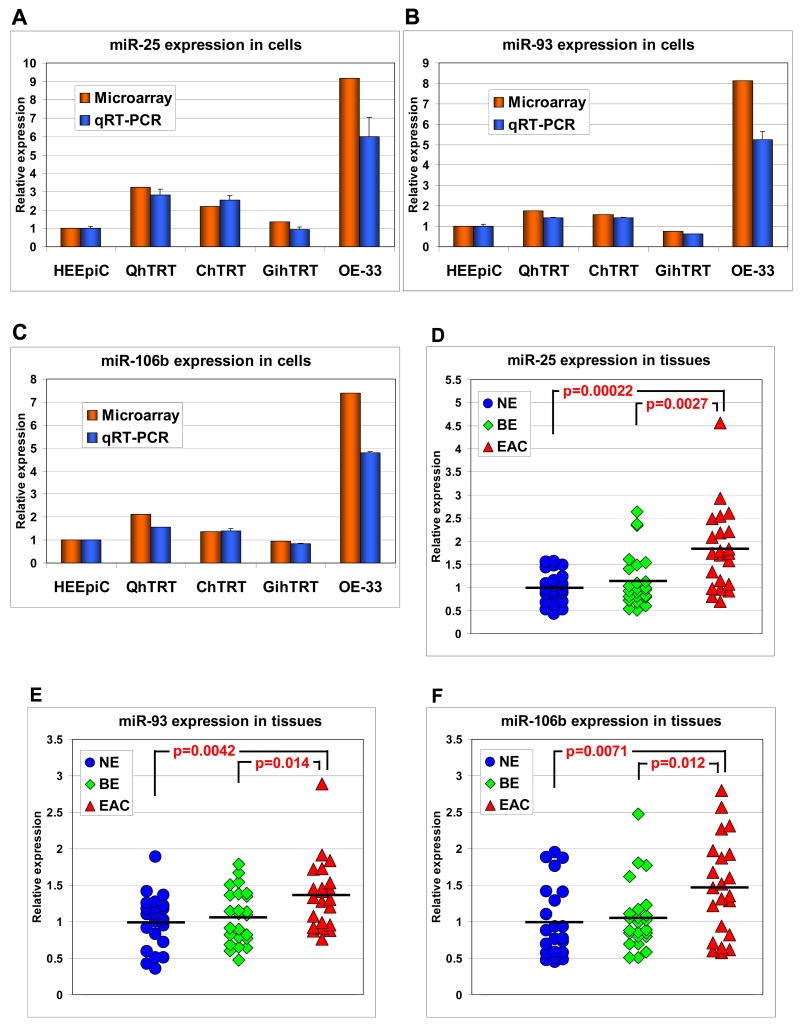
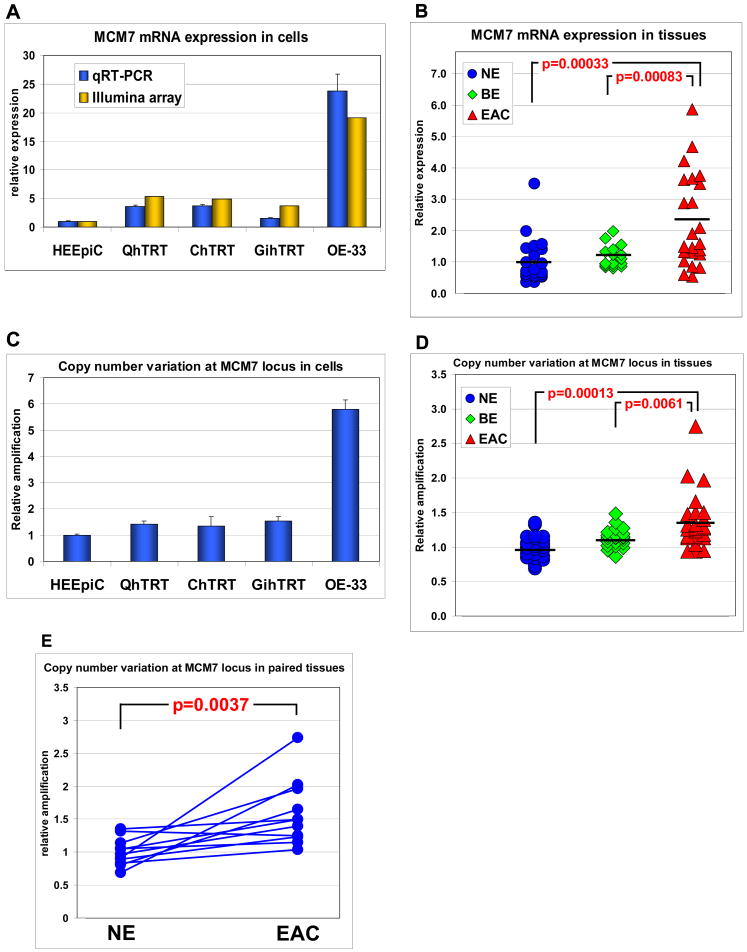
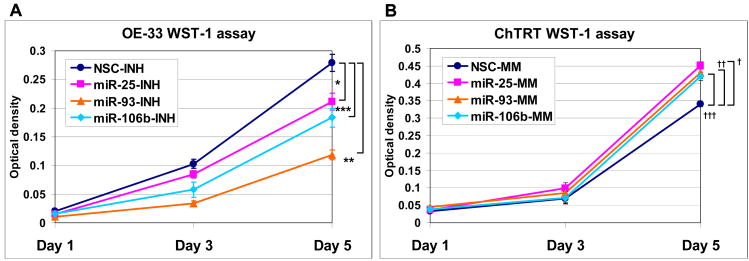
Methods: Esophageal cultured cells (HEEpiC, QhTRT, ChTRT, GihTRT, and OE-33) and esophageal tissues (22 normal epithelia, 24 BE, and 22 EAC) were studied. MiR microarrays and quantitative reverse-transcription polymerase chain reaction (RT-PCR) were employed to explore and verify differentially expressed miRs. Quantitative genomic PCR was performed to study copy number variation at the miR-106b-25 polycistron and MCM7 gene locus on chromosome 7q22.1. In vitro cell proliferation, cell cycle, and apoptosis assays and in vivo tumorigenesis experiments were performed to elucidate biologic effects of the miR-106b-25 polycistron. Western blotting and luciferase assays were performed to confirm direct messenger RNA (mRNA) targeting by the miR-106b-25 polycistron.
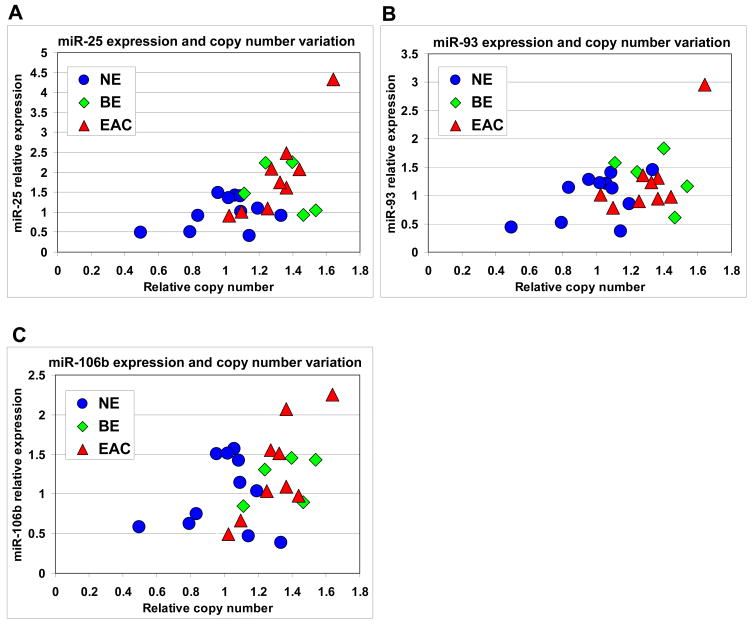
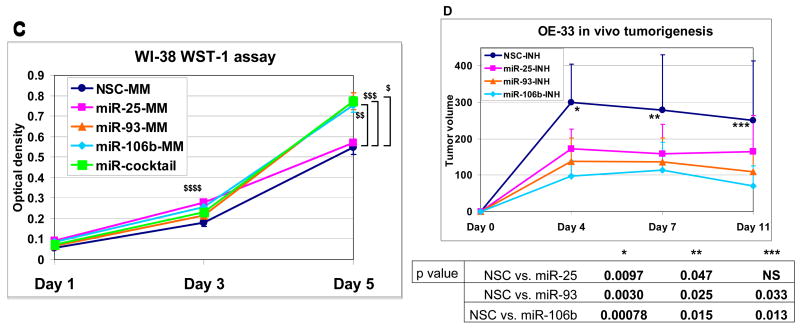
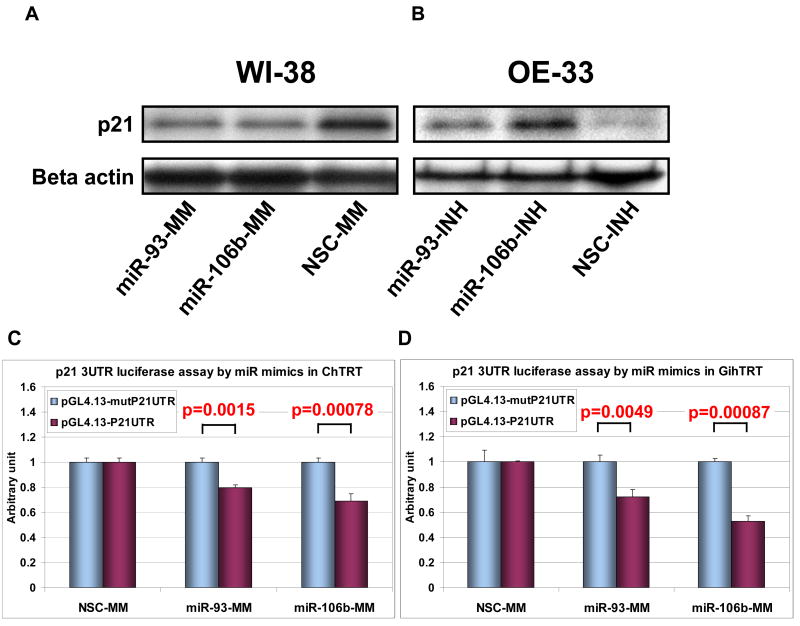
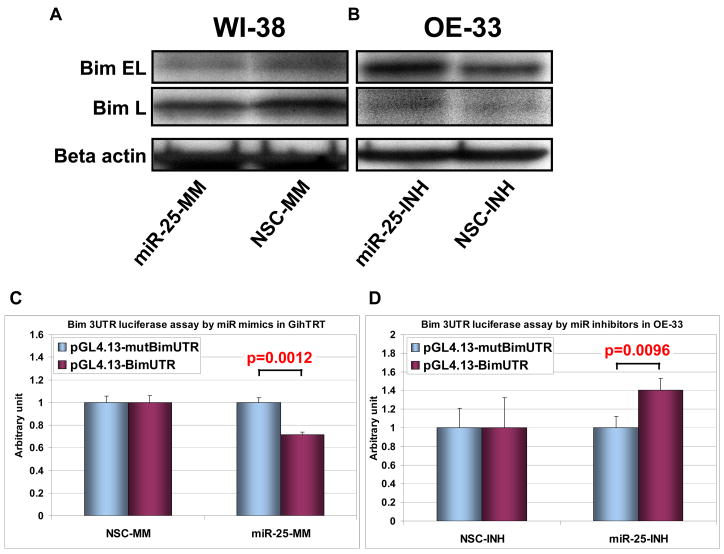
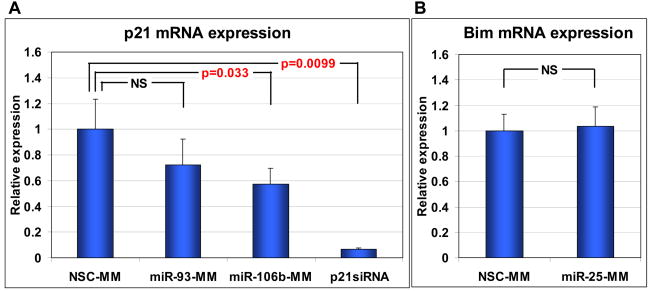
Results: The miR-106b-25 polycistron exerted potential proliferative, antiapoptotic, cell cycle-promoting effects in vitro and tumorigenic activity in vivo. MiRs-93 and -106b targeted and inhibited p21, whereas miR-25 targeted and inhibited Bim. This polycistron was upregulated progressively at successive stages of neoplasia, in association with genomic amplification and overexpression of MCM7. In addition, miRs-93 and -106b decreased p21 mRNA, whereas miR-25 did not alter Bim mRNA, suggesting the following discrete miR effector mechanisms: (1) for p21, mRNA degradation; (2) for Bim, translational inhibition.
Conclusions: The miR-106b-25 polycistron is activated by genomic amplification and is potentially involved in esophageal neoplastic progression and proliferation via suppression of 2 target genes: p21 and Bim.
Conflict of interest statement
Figures
Similar articles
-
MicroRNAs in Barrett's esophagus and esophageal adenocarcinoma.Curr Opin Pharmacol. 2009 Dec;9(6):727-32. doi: 10.1016/j.coph.2009.08.009. Epub 2009 Sep 19. Curr Opin Pharmacol. 2009. PMID: 19773200 Free PMC article. Review.
-
TSA suppresses miR-106b-93-25 cluster expression through downregulation of MYC and inhibits proliferation and induces apoptosis in human EMC.PLoS One. 2012;7(9):e45133. doi: 10.1371/journal.pone.0045133. Epub 2012 Sep 19. PLoS One. 2012. PMID: 23028803 Free PMC article.
-
E2F1-regulated microRNAs impair TGFbeta-dependent cell-cycle arrest and apoptosis in gastric cancer.Cancer Cell. 2008 Mar;13(3):272-86. doi: 10.1016/j.ccr.2008.02.013. Cancer Cell. 2008. PMID: 18328430
-
Bile acids increase levels of microRNAs 221 and 222, leading to degradation of CDX2 during esophageal carcinogenesis.Gastroenterology. 2013 Dec;145(6):1300-11. doi: 10.1053/j.gastro.2013.08.008. Epub 2013 Aug 8. Gastroenterology. 2013. PMID: 23933602
-
A review of the current understanding and clinical utility of miRNAs in esophageal cancer.Semin Cancer Biol. 2013 Dec;23(6 Pt B):512-21. doi: 10.1016/j.semcancer.2013.08.005. Epub 2013 Sep 3. Semin Cancer Biol. 2013. PMID: 24013023 Review.
Cited by
-
MicroRNA and its roles in esophageal cancer.Med Sci Monit. 2012 Mar;18(3):RA22-30. doi: 10.12659/msm.882509. Med Sci Monit. 2012. PMID: 22367141 Free PMC article. Review.
-
MicroRNA-25 promotes gastric cancer proliferation, invasion, and migration by directly targeting F-box and WD-40 Domain Protein 7, FBXW7.Tumour Biol. 2015 Sep;36(10):7831-40. doi: 10.1007/s13277-015-3510-3. Epub 2015 May 6. Tumour Biol. 2015. PMID: 25944166
-
MiR-106b promotes migration and invasion through enhancing EMT via downregulation of Smad 7 in Kazakh's esophageal squamous cell carcinoma.Tumour Biol. 2016 Nov;37(11):14595-14604. doi: 10.1007/s13277-016-5338-x. Epub 2016 Sep 12. Tumour Biol. 2016. PMID: 27619676
-
microRNA-106b-5p Promotes Cell Growth and Sensitizes Chemosensitivity to Sorafenib by Targeting the BTG3/Bcl-xL/p27 Signaling Pathway in Hepatocellular Carcinoma.J Oncol. 2022 Mar 17;2022:1971559. doi: 10.1155/2022/1971559. eCollection 2022. J Oncol. 2022. PMID: 35342408 Free PMC article.
-
The role of microRNAs in ovarian cancer initiation and progression.J Cell Mol Med. 2010 Sep;14(9):2240-9. doi: 10.1111/j.1582-4934.2010.01058.x. J Cell Mol Med. 2010. PMID: 20345848 Free PMC article. Review.
References
-
- Shaheen NJ. Advances in Barrett’s esophagus and esophageal adenocarcinoma. Gastroenterology. 2005;128:1554–66. - PubMed
-
- Cameron AJ, Lomboy CT. Barrett’s esophagus: age, prevalence, and extent of columnar epithelium. Gastroenterology. 1992;103:1241–5. - PubMed
-
- Hirota WK, Loughney TM, Lazas DJ, et al. Specialized intestinal metaplasia, dysplasia, and cancer of the esophagus and esophagogastric junction: prevalence and clinical data. Gastroenterology. 1999;116:277–85. - PubMed
-
- Ronkainen J, Aro P, Storskrubb T, et al. Prevalence of Barrett’s esophagus in the general population: an endoscopic study. Gastroenterology. 2005;129:1825–31. - PubMed
-
- Sampliner RE. A population prevalence of Barrett’s esophagus--finally. Gastroenterology. 2005;129:2101–3. - PubMed
Publication types
MeSH terms
Substances
Grants and funding
LinkOut - more resources
Full Text Sources
Other Literature Sources
Medical
