

Accentuation of suicides but not homicides with rising latitudes of Greenland in the sunny months
- PMID: 19422728
- PMCID: PMC2685778
- DOI: 10.1186/1471-244X-9-20
Accentuation of suicides but not homicides with rising latitudes of Greenland in the sunny months
Abstract
Background: Seasonal variation in suicides has been shown in many countries. We assessed the seasonality and the variation with latitude in suicides and homicides, and the impact of alcohol on the seasonality in suicides.
Methods: Official computerized registers on causes of death in all Greenland during 1968-2002 were used. Sales data on beer from one of the major food store chains for July 2005-June 2006 were examined. Seasonal variation was assessed by Rayleigh's test for circular distributions.
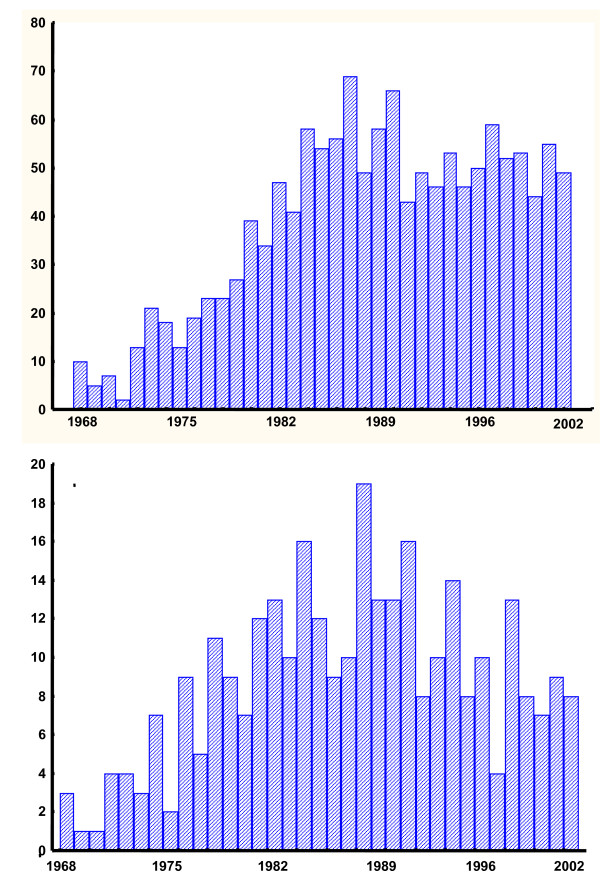
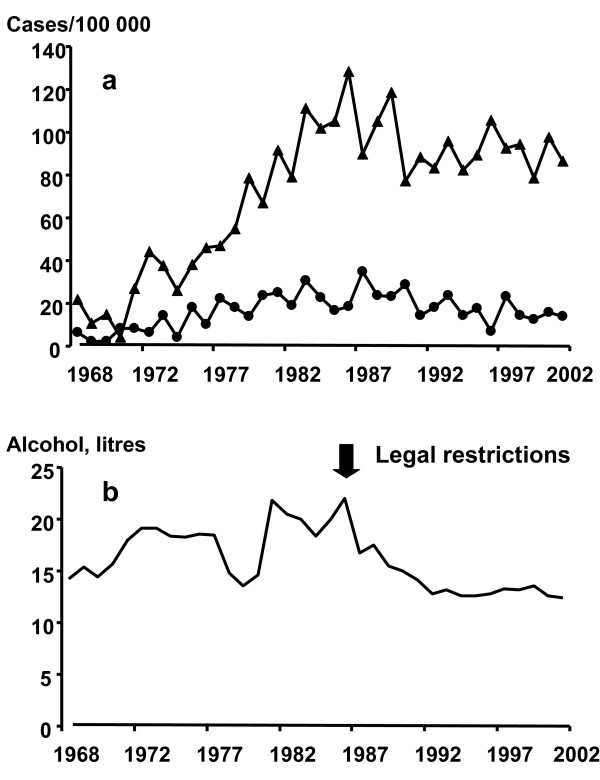
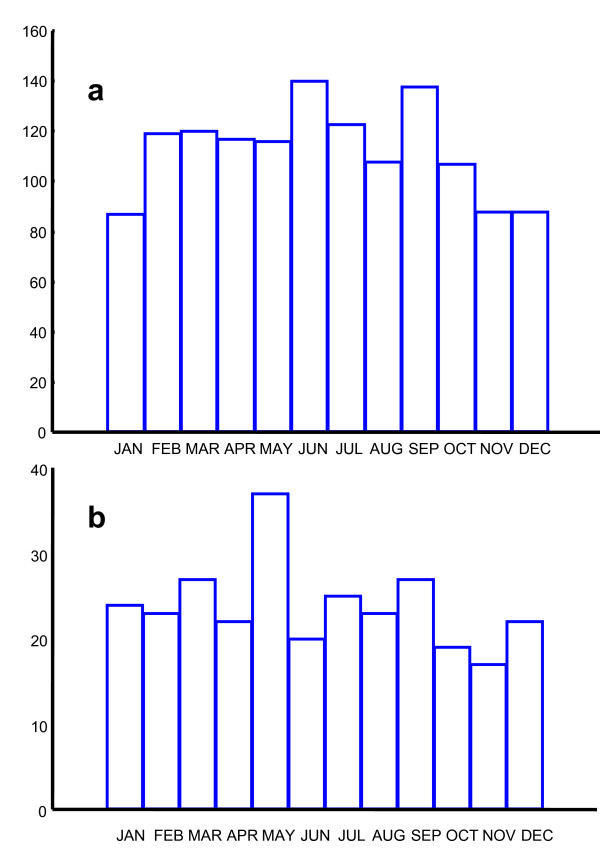
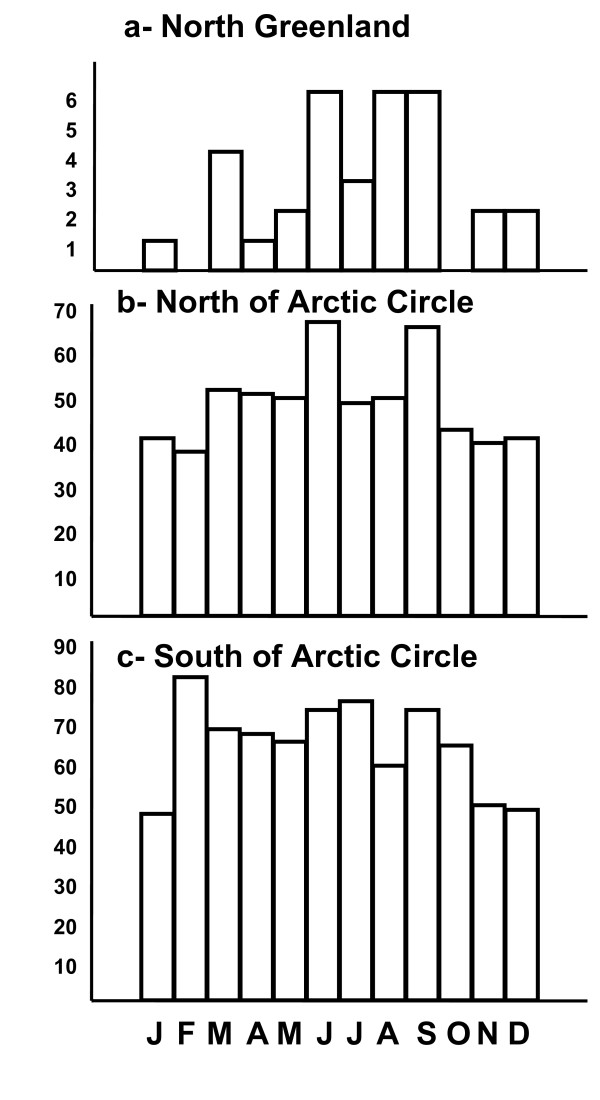
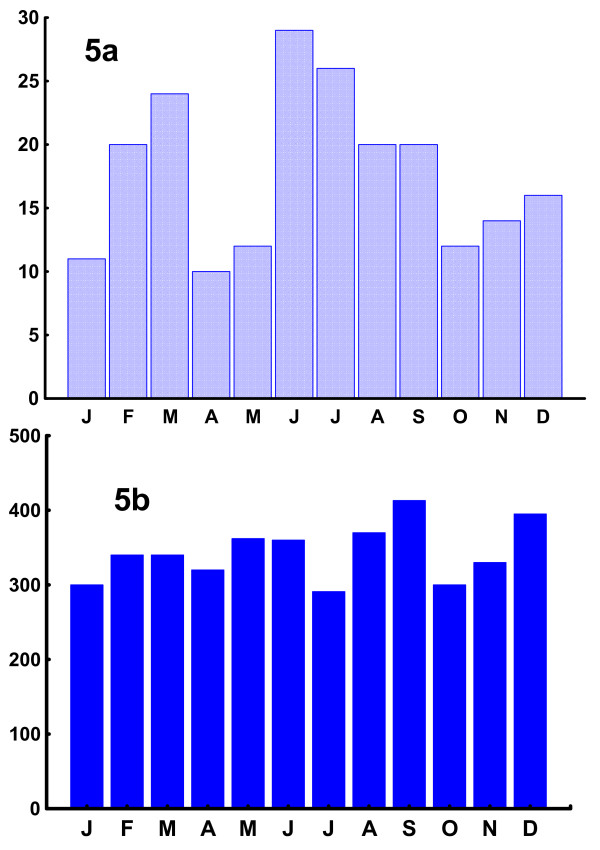
Results: There were a total of 1351 suicides and 308 homicides. The suicides rate varied from 4.2/100 000 person-years in 1971 to 128.4/100 000 person-years in 1987. The homicide rate varied from 2.1/100000 person-years in 1969-1970 to 34.8/100 000 person-years in 1988. Out of the 1351 suicides, 80.5% were committed by men and 19.5% by women. Median age was 25 years (n = 1351; Range 11-84 years). Violent methods of suicide were used in 95% of all cases (n = 1286). Out of the 308 homicide victims, 61% were men and 39% were women, and 13% were killed in multiple homicide events.There was a significant seasonal variation with peaks in June and troughs in the winter in all suicide cases (n = 1351, r = 0.07; Z = 7.58, p < 0.001), in violent suicides (n = 1286; r = 0.07; Z = 6.97; p < 0,001), in suicides in men (n = 1087; r = 0.07; Z = 5.39; p < 0.002) , and in women (n = 264; r = 0.10; Z = 2.36; p < 0.05), but not in homicides nor in consumption of beer. There was a bi-phasic seasonal variation in suicide victims where an alcohol-related condition was included in the death certificate. Suicides were more concentrated in the summer months north of the Arctic Circle (n = 577, r = 0.09, Z = 4.45, p < 0.01) than south of it (n = 769, r = 0.07, Z = 3.76, p < 0.002) and most concentrated in North Greenland (n = 33; r = 0.35; Z = 4.11; p < 0.01), where 48% of suicides occurred during the period of constant light. When including astronomical twilight in the constant light period 82% occurred during this time.
Conclusion: There was a concentration of suicides but not homicides in the summer months in all Greenland. The concentration was most pronounced at high latitudes.
Figures
References
-
- Durkheim E. Le suicide. Paris. 1897.
Publication types
MeSH terms
LinkOut - more resources
Full Text Sources
Medical
