Comparative Study
. 2009 May;5(5):e1000471.
doi: 10.1371/journal.pgen.1000471. Epub 2009 May 8.

Widespread genomic signatures of natural selection in hominid evolution

Affiliations
Comparative Study

Widespread genomic signatures of natural selection in hominid evolution

Graham McVicker et al. PLoS Genet. 2009 May.

Abstract

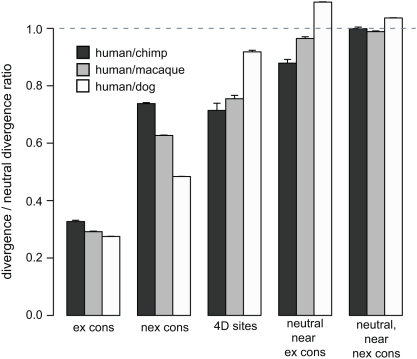
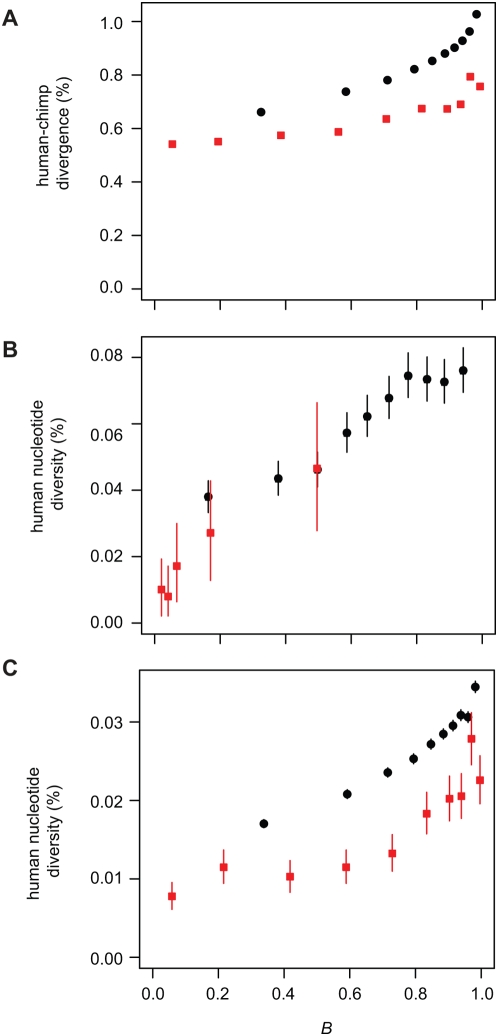
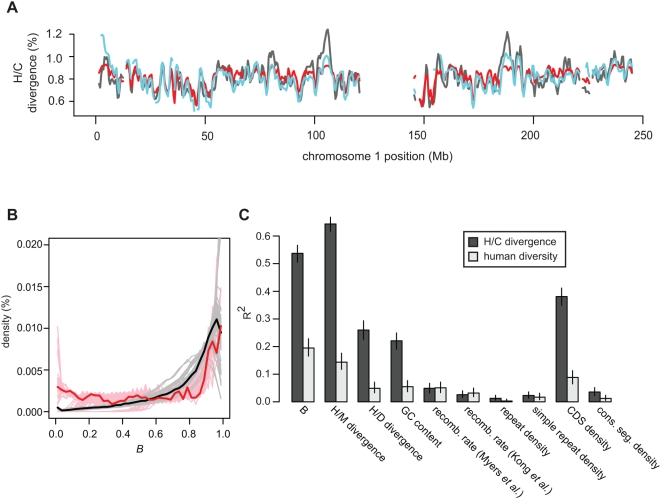
Selection acting on genomic functional elements can be detected by its indirect effects on population diversity at linked neutral sites. To illuminate the selective forces that shaped hominid evolution, we analyzed the genomic distributions of human polymorphisms and sequence differences among five primate species relative to the locations of conserved sequence features. Neutral sequence diversity in human and ancestral hominid populations is substantially reduced near such features, resulting in a surprisingly large genome average diversity reduction due to selection of 19-26% on the autosomes and 12-40% on the X chromosome. The overall trends are broadly consistent with "background selection" or hitchhiking in ancestral populations acting to remove deleterious variants. Average selection is much stronger on exonic (both protein-coding and untranslated) conserved features than non-exonic features. Long term selection, rather than complex speciation scenarios, explains the large intragenomic variation in human/chimpanzee divergence. Our analyses reveal a dominant role for selection in shaping genomic diversity and divergence patterns, clarify hominid evolution, and provide a baseline for investigating specific selective events.


Conflict of interest statement

The authors have declared that no competing interests exist.

Figures

Figure 1
Figure 1. Species and populations analyzed.
Ancestral effective population sizes, N, and interspeciation times in generations, T, were estimated by fitting a model of selection to five-primate sequence data (Table 1 contains all parameter estimates). Parameter values were calibrated by assuming human/chimpanzee speciation occurred 240,000 generations ago; a different calibration would multiply all values by a constant factor. The times between speciation in millions of years (MY) are shown in parentheses, assuming a constant generation time of 25 years. The old world monkey/great ape divergence time is older than suggested by the fossil record , but can potentially be explained by generation times that have increased during hominid evolution or a more recent human/chimpanzee speciation time than was used for calibration.
Figure 2
Figure 2. Most genomic bases are near a conserved segment.
Plots show the percentage of the genome that is within a given distance of a conserved segment (solid curve) or protein coding sequence (broken curve). (A) Physical distances. (B) Genetic distances according to a fine-scale recombination map .
Figure 3
Figure 3. Human diversity, interspecies divergence and HG and CG sites are reduced near evolutionarily conserved segments.
(A) Ratios calculated using the 10% of neutral sites which are nearest to and the 50% of neutral sites farthest away from conserved segments or exons. (B) The same ratios as (A) but normalized by human/macaque (H/M) divergence to account for mutation rate variation or undetected sites under purifying selection. The distance to the nearest conserved segment or exon was determined using four different measures: physical distance, pedigree-based recombination distance , polymorphism-based finescale recombination distance and the background selection parameter, B. B (described in the main text) is not technically a distance measure but incorporates information about the recombination rate and local density of conserved segments. Autosomal human nucleotide diversity was calculated from gene-centric SeattleSNPs PGA/EGP , whole-genome Perlegen data, and HapMap phase II data . Divergence was estimated using autosomal human/chimp (H/C), human/macaque (H/M), or human/dog (H/D) genome sequence data. HG and CG sites (where human and gorilla or chimp and gorilla share a nucleotide that differs from the other three species) were calculated using a smaller set of 5-species autosomal data. Repetitive regions were omitted from the Perlegen and HapMap analyses; additional filtering steps are described in the methods. Whiskers are 95% confidence intervals.
Figure 4
Figure 4. Neutral divergence increases with recombination distance from conserved exonic segments.
Divergence in putatively neutral sites was calculated for the human branch (black circles), chimpanzee branch (red squares) and outgroup macaque branch (blue diamonds) and binned by finescale recombination distance from exonic conserved segments. Divergence is presented as relative to that of the first bin. Fifty bins of equal numbers of sites were used. Vertical lines are 95% confidence intervals.
Figure 5
Figure 5. Divergence as a fraction of neutral divergence in conserved and neutral sites near conserved sites.
We estimated human/chimp (H/C), human/macaque (H/M) and human/dog (H/D) divergence in exonic conserved segments (ex cons), non-exonic conserved segments (nex cons), fourfold degenerate (4D) sites (both neutral and conserved sites), and neutral segments within 100 bp of conserved segments using autosomal genomic alignments. These divergence estimates were then divided by the overall neutral divergence estimated from all autosomal neutral sites. The higher H/D divergence near conserved segments is likely an artefact of the Hidden Markov Model, which tends to terminate conserved segments at divergent bases (the dog sequence was used for conserved segment identification, but the human and macaque sequences were not). Whiskers are 95% confidence intervals.
Figure 6
Figure 6. Whole-genome neutral divergence and diversity show strong dependence on the estimated strength of background selection.
(A) Human/chimpanzee divergence from whole-genome alignments for autosomes (black circles) and chromosome X (red squares) versus B (the portion of neutral diversity expected to remain after accounting for background selection). (B) Human nucleotide diversity from Seattle SNPs PGA/EGP data versus B. (C) Human nucleotide diversity from Perlegen data. Estimated diversity is much lower in the Perlegen dataset because it subsamples common variants . Vertical lines are 95% confidence intervals (not visible in (A) because they are smaller than the plotting symbols). Note that although human diversity shows a clear linear relationship to B, a fitted line would not pass through the origin as it should if the 5-species estimates are applicable to recent human evolution. This likely reflects the sharp decrease in human effective population size relative to ancestral primate populations, which is expected to reduce the efficiency of selection on weakly deleterious mutations due to increased genetic drift .
Figure 7
Figure 7. Selection can explain most large-scale regional variation in human/chimpanzee divergence and human diversity.
(A) Observed (black line) and predicted H/C divergence across chromosome 1, from a background selection model that assumes a uniform mutation rate (red line) or a mutation rate that varies with local human/dog divergence (blue line). This plot was created with a 1 Mb sliding window with 0.5 Mb of overlap. (B) The distribution of estimated B values on autosomes (black line) and chromosome X (red line). Grey (autosomes) and pink (chromosome X) lines are distributions of B values from 100 bootstrap iterations. (C) Pairwise correlations (Spearman's rank squared) with regional human/chimpanzee (H/C) divergence and human diversity in non-overlapping 1 Mb windows across all autosomes. The same trends are observed across a wide range of window sizes (see Figure S6).Whiskers are 95% confidence intervals.

References

    1. Eddy SR. A model of the statistical power of comparative genome sequence analysis. PLoS Biol. 2005;3:e10. - PMC - PubMed
    1. Charlesworth B, Morgan MT, Charlesworth D. The effect of deleterious mutations on neutral molecular variation. Genetics. 1993;134:1289–1303. - PMC - PubMed
    1. Maynard Smith J, Haigh J. The hitch-hiking effect of a favourable gene. Genet Res. 1974;23:23–35. - PubMed
    1. Hudson RR, Kaplan NL. Deleterious background selection with recombination. Genetics. 1995;141:1605–1617. - PMC - PubMed
    1. Nordborg M, Charlesworth B, Charlesworth D. The effect of recombination on background selection. Genet Res. 1996;67:159–174. - PubMed

Publication types