. 2009 May;20(5):281-95.
doi: 10.1007/s00335-009-9181-x. Epub 2009 May 8.

Intra- and inter-individual genetic differences in gene expression

Affiliations

Intra- and inter-individual genetic differences in gene expression

Mark J Cowley et al. Mamm Genome. 2009 May.

Abstract

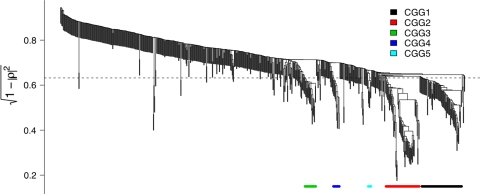
Genetic variation is known to influence the amount of mRNA produced by a gene. Because molecular machines control mRNA levels of multiple genes, we expect genetic variation in components of these machines would influence multiple genes in a similar fashion. We show that this assumption is correct by using correlation of mRNA levels measured from multiple tissues in mouse strain panels to detect shared genetic influences. These correlating groups of genes (CGGs) have collective properties that on average account for 52-79% of the variability of their constituent genes and can contain genes that encode functionally related proteins. We show that the genetic influences are essentially tissue-specific and, consequently, the same genetic variations in one animal may upregulate a CGG in one tissue but downregulate the CGG in a second tissue. We further show similarly paradoxical behaviour of CGGs within the same tissues of different individuals. Thus, this class of genetic variation can result in complex inter- and intraindividual differences. This will create substantial challenges in humans, where multiple tissues are not readily available.


Figures

Fig. 1
Fig. 1
The average expression level (A value) in brain (blue), kidney (green), and liver (red) for each of the 755 genetically influenced genes in DBA/2J and C57BL/6J is plotted, with expression level on the y axis (log2 scale), ordered from left to right with increasing average expression in all three tissues. Note the deliberate absence of genes that are expressed in only one of the three tissues due to limiting to those genes that were expressed above background in all three tissues (see Materials and methods)
Fig. 2
Fig. 2
Dendrogram formed by single-linkage hierarchical clustering of the 755-gene cross-tissue matrix. The distance metric used was a monotonically decreasing function of the absolute value of Spearman’s |ρ|, namely, √(1 − |ρ|2). The value of this metric equivalent to that used to generate the correlated groups of genes (CGGs) (0.623 ≡ |ρ| = 0.775) is shown as a horizontal dashed line. Genes in the five largest CGGs are colour-coded
Fig. 3
Fig. 3
a Correlations between genes are displayed as a network: Edges connect two genes if those genes are correlated with an absolute value of Spearman’s |ρ| > 0.775. Two hundred twelve of the 755 genetically influenced genes (see text) pass this threshold and are positioned in the x, y plane based on a 2D Fruchterman-Reingold layout algorithm (Fruchterman and Reingold 1991). Correlated groups of genes (CGGs) with at least three genes in them are coloured, and the five largest are numbered. When split into two parts, as per the black curved line, CGG 2 displays coherent expression patterns and functional clustering (see text). b Panels show the mRNA expression ratios of genes in the relevant CGGs measured in each BXD strain in three tissues (1st panel, brain; 2nd panel, kidney; and 3rd panel, liver). The vertical axis is the expression ratio vs. C57BL/6J (M values) of mRNA level in each of the 31 BXD strains (horizontal axis). Each individual gene’s M values are plotted as black lines, with thick coloured lines representing the CGG centroids (blue, green, and red for brain, kidney, and liver, respectively). Note the striking differences in the expression patterns of the CGG centroids in the three different tissues
Fig. 4
Fig. 4
The extent of shared rather than individual influence on a gene’s expression level. Note that a very high proportion of the variation in many individual genes’ mRNA levels can be accounted for by the influence of shared rather than gene-specific influences. Box-and-whisker plots represent the R2 between each CGG’s centroid to each gene in the CGG, independently evaluated for the brain mRNA levels only (B, blue), for the kidney (K, green), or for the liver (L, red) or across all three tissues (all 3, black). Each box represents mRNA levels falling in the 25th to the 75th percentile, the thick line the median, and the whiskers extend to at most two standard deviations away from the median, with outliers indicated with circles. The horizontal width of each box is proportional to the number of genes in each CGG
Fig. 5
Fig. 5
Coherency analysis. a Coherency overview: An example CGG containing 12 genes is identified by correlation analysis in the 31 BXD strains; the expression ratios from a comparison of two mouse strains for each of these 12 genes are shown (most genes are upregulated). The coherency score is calculated and statistical significance is determined via permutation (see Methods subsection “Coherency test statistic”). The resulting coherency and statistical significance are displayed as an annotated histogram. This process is repeated for all CGGs in expression data from all three tissues. b Intraindividual coherency: We plot the coherency scores for each CGG in the brain, kidney, and liver for DBA/2J vs. C57BL/6J in the first row (blue, green, and red, respectively) and for SJL/J vs. C57BL/6J in the second row (light blue, light green, and orange, respectively). c Interindividual coherency: The same data from panel B but reordered so that the tissues are grouped together. Stars indicate the degree of statistical significance (*P < 0.05, **P = 0.001)

References

    1. {'text': '', 'ref_index': 1, 'ids': [{'type': 'PMC', 'value': 'PMC1828749', 'is_inner': False, 'url': 'https://pmc.ncbi.nlm.nih.gov/articles/PMC1828749/'}, {'type': 'PubMed', 'value': '17299415', 'is_inner': True, 'url': 'https://pubmed.ncbi.nlm.nih.gov/17299415/'}]}
    2. Bansal M, Belcastro V, Ambesi-Impiombato A, di Bernardo D (2007) How to infer gene networks from expression profiles. Mol Syst Biol 3:78 - PMC - PubMed
    1. {'text': '', 'ref_index': 1, 'ids': [{'type': 'DOI', 'value': '10.1016/j.tig.2007.08.003', 'is_inner': False, 'url': 'https://doi.org/10.1016/j.tig.2007.08.003'}, {'type': 'PubMed', 'value': '17822800', 'is_inner': True, 'url': 'https://pubmed.ncbi.nlm.nih.gov/17822800/'}]}
    2. Batada NN, Urrutia AO, Hurst LD (2007) Chromatin remodelling is a major source of coexpression of linked genes in yeast. Trends Genet 23(10):480–484 - PubMed
    1. {'text': '', 'ref_index': 1, 'ids': [{'type': 'DOI', 'value': '10.1186/1471-2105-9-244', 'is_inner': False, 'url': 'https://doi.org/10.1186/1471-2105-9-244'}, {'type': 'PMC', 'value': 'PMC2424053', 'is_inner': False, 'url': 'https://pmc.ncbi.nlm.nih.gov/articles/PMC2424053/'}, {'type': 'PubMed', 'value': '18492285', 'is_inner': True, 'url': 'https://pubmed.ncbi.nlm.nih.gov/18492285/'}]}
    2. Biswas S, Storey JD, Akey JM (2008) Mapping gene expression quantitative trait loci by singular value decomposition and independent component analysis. BMC Bioinformatics 9:244 - PMC - PubMed
    1. {'text': '', 'ref_index': 1, 'ids': [{'type': 'DOI', 'value': '10.1083/jcb.200311021', 'is_inner': False, 'url': 'https://doi.org/10.1083/jcb.200311021'}, {'type': 'PMC', 'value': 'PMC2172132', 'is_inner': False, 'url': 'https://pmc.ncbi.nlm.nih.gov/articles/PMC2172132/'}, {'type': 'PubMed', 'value': '15240568', 'is_inner': True, 'url': 'https://pubmed.ncbi.nlm.nih.gov/15240568/'}]}
    2. Blache P, van de Wetering M, Duluc I, Domon C, Berta P et al (2004) SOX9 is an intestine crypt transcription factor, is regulated by the Wnt pathway, and represses the CDX2 and MUC2 genes. J Cell Biol 166(1):37–47 - PMC - PubMed
    1. {'text': '', 'ref_index': 1, 'ids': [{'type': 'DOI', 'value': '10.1073/pnas.0408709102', 'is_inner': False, 'url': 'https://doi.org/10.1073/pnas.0408709102'}, {'type': 'PMC', 'value': 'PMC547855', 'is_inner': False, 'url': 'https://pmc.ncbi.nlm.nih.gov/articles/PMC547855/'}, {'type': 'PubMed', 'value': '15659551', 'is_inner': True, 'url': 'https://pubmed.ncbi.nlm.nih.gov/15659551/'}]}
    2. Brem RB, Kruglyak L (2005) The landscape of genetic complexity across 5,700 gene expression traits in yeast. Proc Natl Acad Sci USA 102(5):1572–1577 - PMC - PubMed

Publication types