

Genome-wide association analysis identifies PDE4D as an asthma-susceptibility gene
- PMID: 19426955
- PMCID: PMC2681010
- DOI: 10.1016/j.ajhg.2009.04.006
Genome-wide association analysis identifies PDE4D as an asthma-susceptibility gene
Abstract
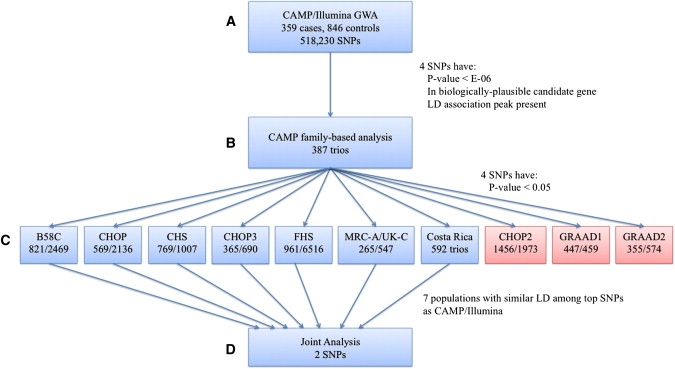
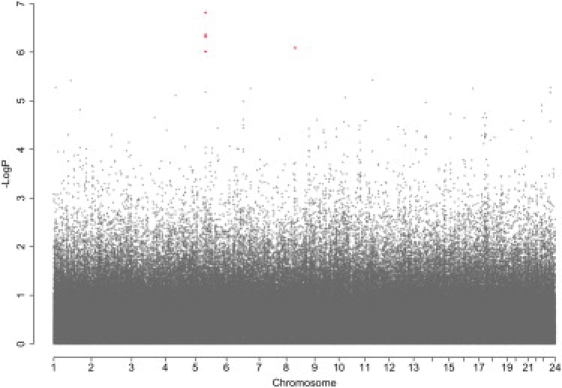
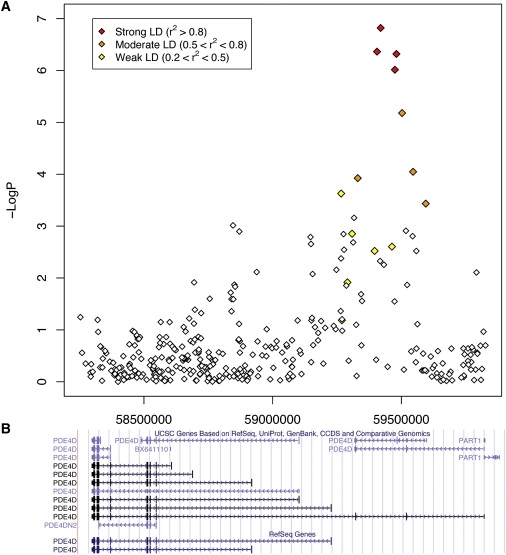
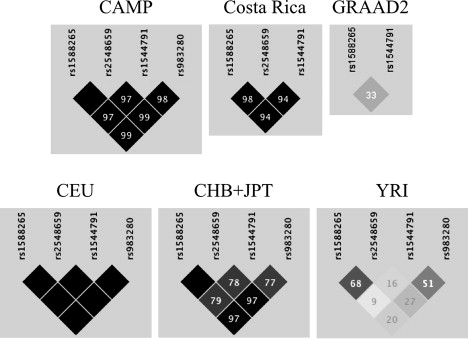
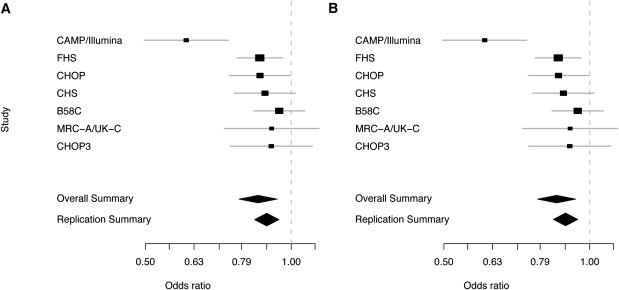
Asthma, a chronic airway disease with known heritability, affects more than 300 million people around the world. A genome-wide association (GWA) study of asthma with 359 cases from the Childhood Asthma Management Program (CAMP) and 846 genetically matched controls from the Illumina ICONdb public resource was performed. The strongest region of association seen was on chromosome 5q12 in PDE4D. The phosphodiesterase 4D, cAMP-specific (phosphodiesterase E3 dunce homolog, Drosophila) gene (PDE4D) is a regulator of airway smooth-muscle contractility, and PDE4 inhibitors have been developed as medications for asthma. Allelic p values for top SNPs in this region were 4.3 x 10(-07) for rs1588265 and 9.7 x 10(-07) for rs1544791. Replications were investigated in ten independent populations with different ethnicities, study designs, and definitions of asthma. In seven white and Hispanic replication populations, two PDE4D SNPs had significant results with p values less than 0.05, and five had results in the same direction as the original population but had p values greater than 0.05. Combined p values for 18,891 white and Hispanic individuals (4,342 cases) in our replication populations were 4.1 x 10(-04) for rs1588265 and 9.2 x 10(-04) for rs1544791. In three black replication populations, which had different linkage disequilibrium patterns than the other populations, original findings were not replicated. Further study of PDE4D variants might lead to improved understanding of the role of PDE4D in asthma pathophysiology and the efficacy of PDE4 inhibitor medications.
Figures
References
-
- American Lung Association . Epidemiology and Statistics Unit, Research and Program Services, American Lung Association; New York, NY: 2006. Trends in Asthma Morbidity and Mortality.
-
- Global Initiative for Asthma Management and Prevention . US Department of Health and Human Services; Bethesda, MD: 1995. NHLBI/WHO Workshop Report. National Institutes of Health.
-
- Ober C., Hoffjan S. Asthma genetics 2006: The long and winding road to gene discovery. Genes Immun. 2006;7:95–100. - PubMed
-
- Moffatt M.F., Kabesch M., Liang L., Dixon A.L., Strachan D., Heath S., Depner M., von Berg A., Bufe A., Rietschel E. Genetic variants regulating ORMDL3 expression contribute to the risk of childhood asthma. Nature. 2007;448:470–473. - PubMed
-
- Sleiman P.M., Annaiah K., Imielinski M., Bradfield J.P., Kim C.E., Frackelton E.C., Glessner J.T., Eckert A.W., Otieno F.G., Santa E. ORMDL3 variants associated with asthma susceptibility in North Americans of European ancestry. J. Allergy Clin. Immunol. 2008;122:1225–1227. - PubMed
Publication types
MeSH terms
Substances
Grants and funding
- U01 HL65899/HL/NHLBI NIH HHS/United States
- T15 LM007092/LM/NLM NIH HHS/United States
- 068545/Z/02/WT_/Wellcome Trust/United Kingdom
- U01 HL065899/HL/NHLBI NIH HHS/United States
- 5R01HL087680/HL/NHLBI NIH HHS/United States
- P01 ES011627/ES/NIEHS NIH HHS/United States
- U01 HL075419/HL/NHLBI NIH HHS/United States
- G0000934/MRC_/Medical Research Council/United Kingdom
- WT_/Wellcome Trust/United Kingdom
- R01 HL086601/HL/NHLBI NIH HHS/United States
- 2T15LM007092-16/LM/NLM NIH HHS/United States
- T32 HL07427/HL/NHLBI NIH HHS/United States
- P30 ES007048/ES/NIEHS NIH HHS/United States
- P01 HL083069/HL/NHLBI NIH HHS/United States
- 5P01ES011627/ES/NIEHS NIH HHS/United States
- R37 HL066289/HL/NHLBI NIH HHS/United States
- R01 HL087680/HL/NHLBI NIH HHS/United States
- K08 HL092222/HL/NHLBI NIH HHS/United States
- T32 HL007427/HL/NHLBI NIH HHS/United States
- 5P30ES007048/ES/NIEHS NIH HHS/United States
LinkOut - more resources
Full Text Sources
Medical
Molecular Biology Databases