

Denoising neural data with state-space smoothing: method and application
- PMID: 19428519
- PMCID: PMC2680758
- DOI: 10.1016/j.jneumeth.2009.01.013
Denoising neural data with state-space smoothing: method and application
Abstract
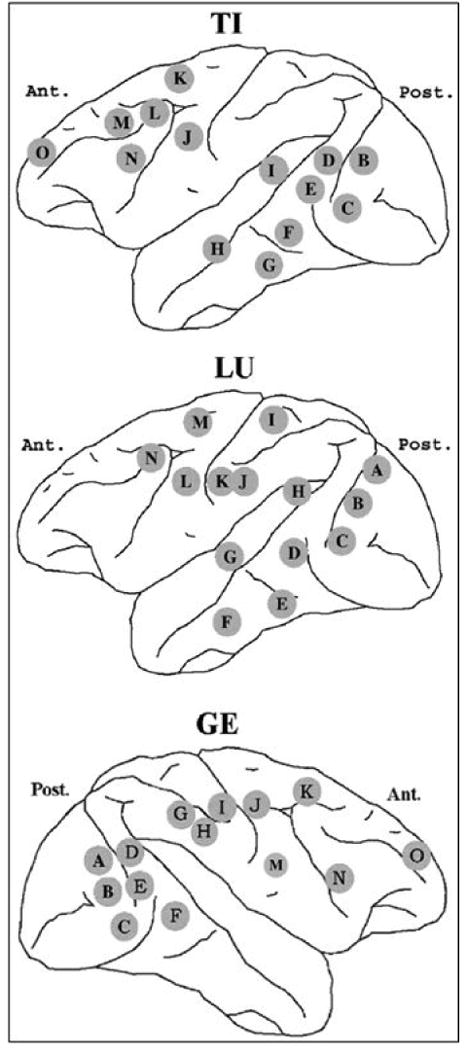
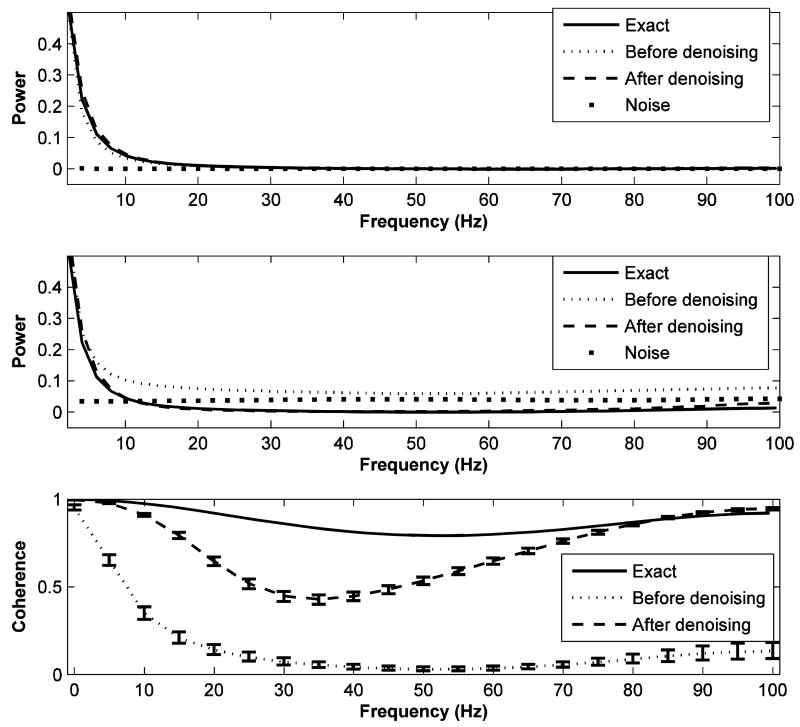
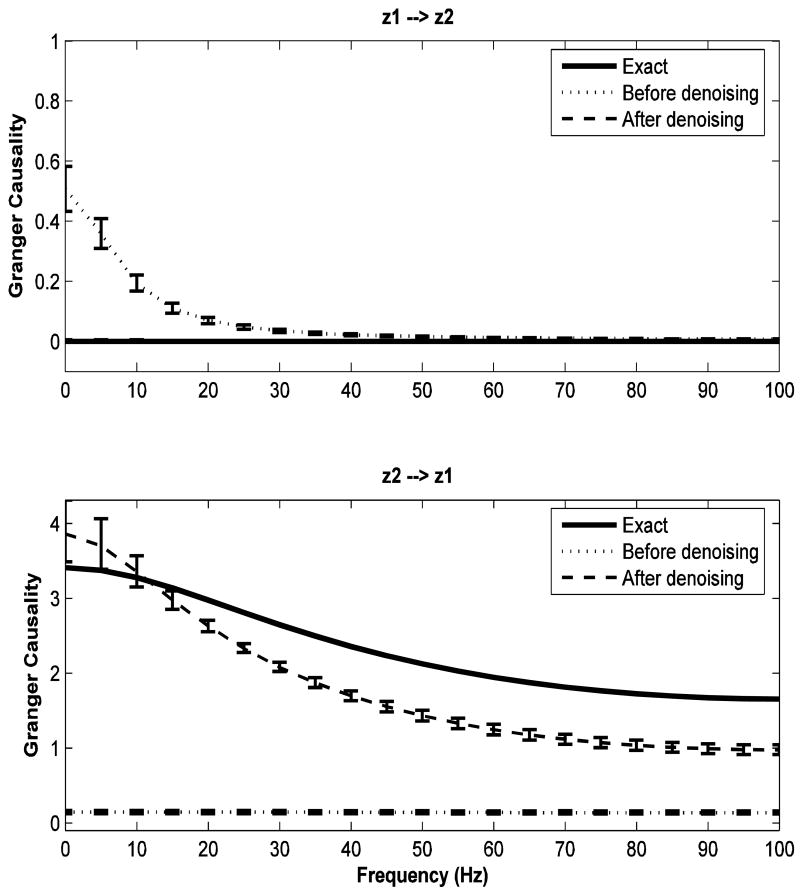
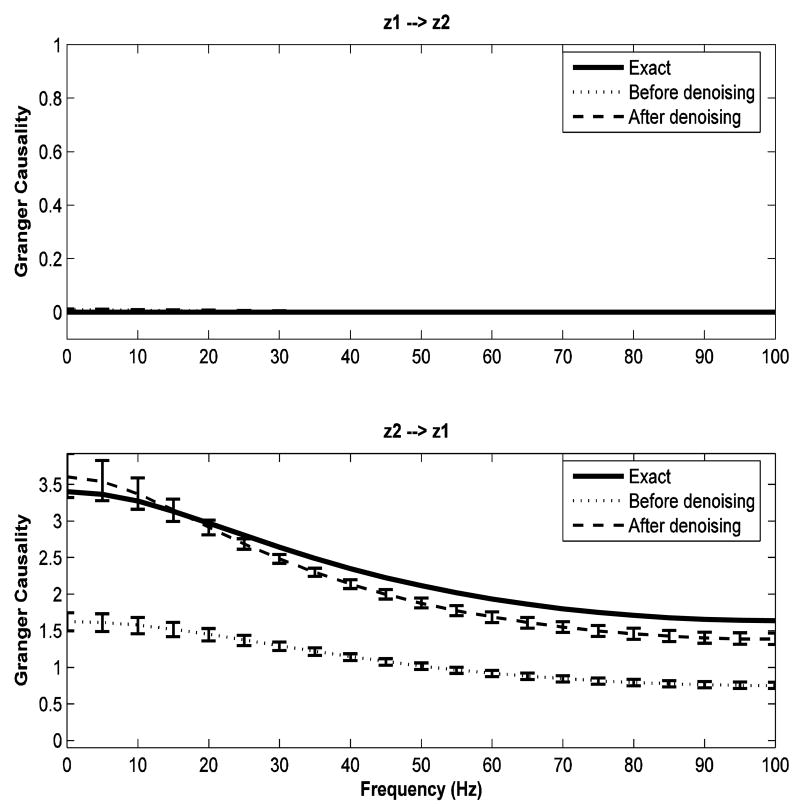
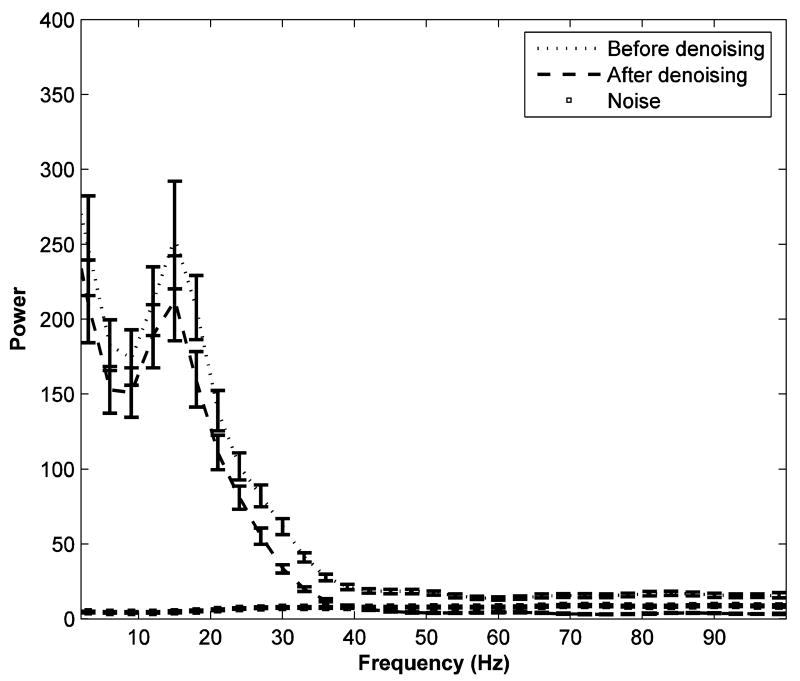
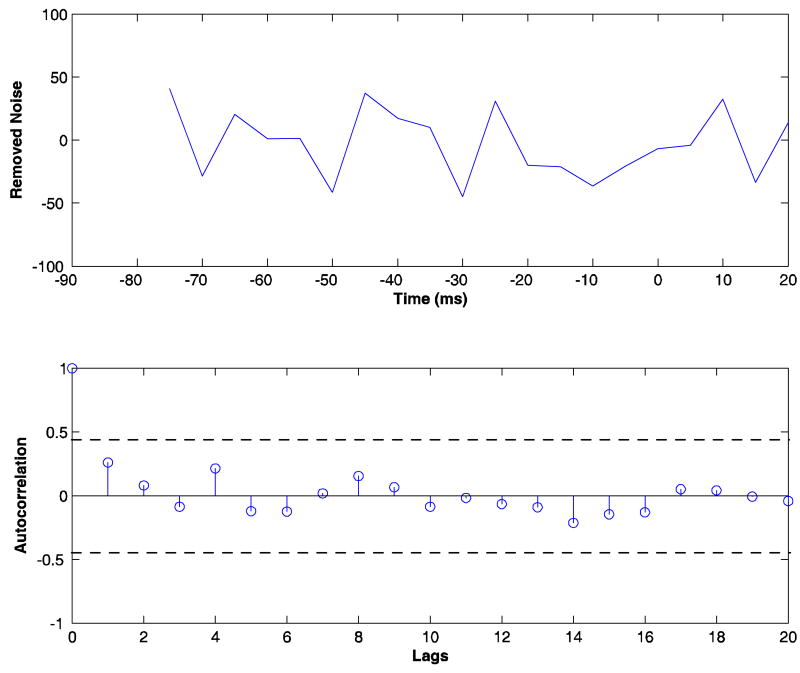
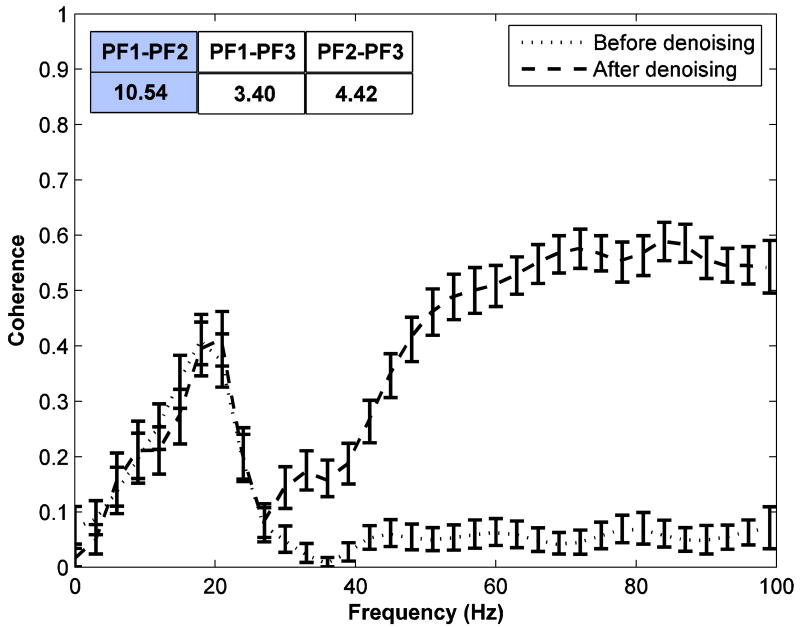
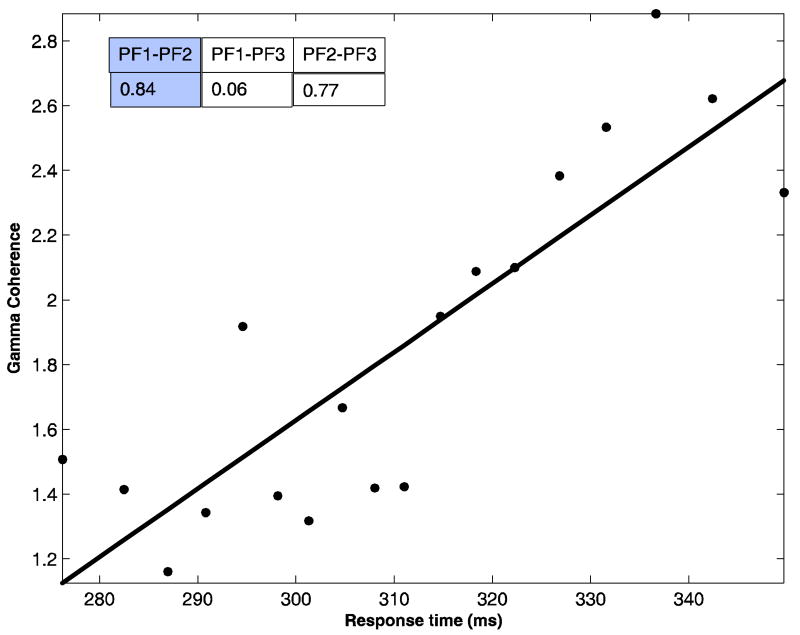
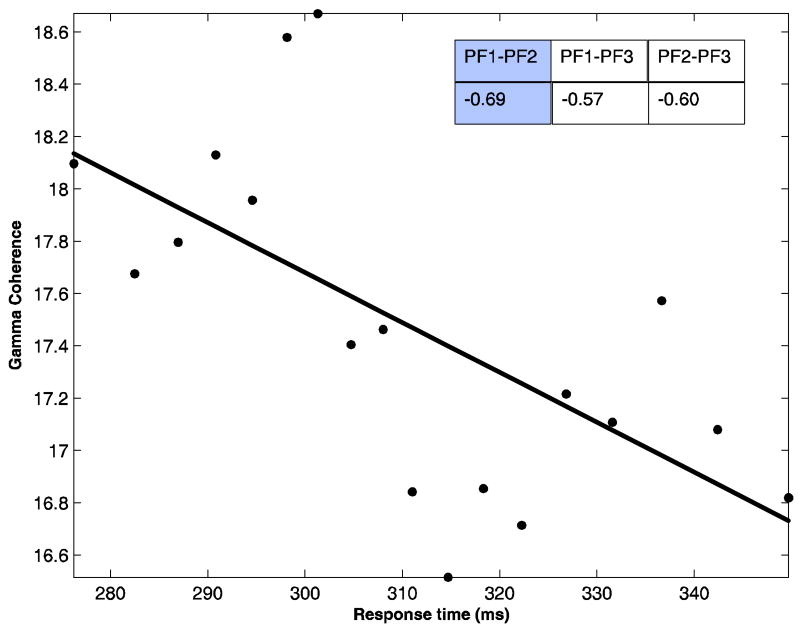
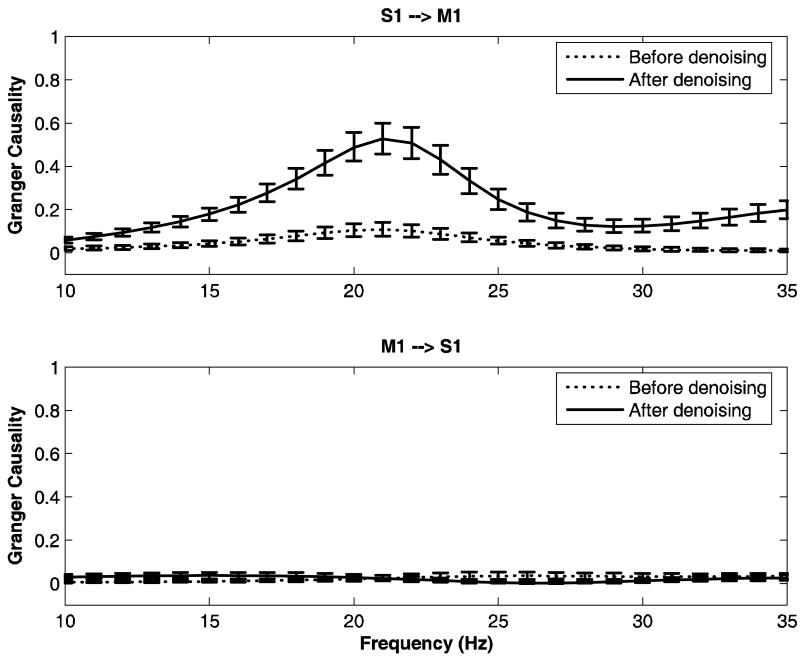
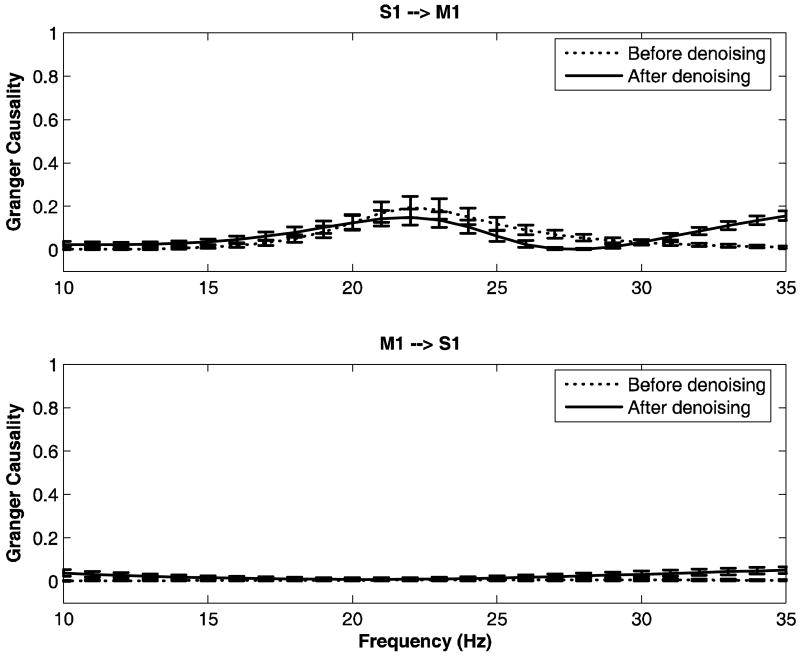
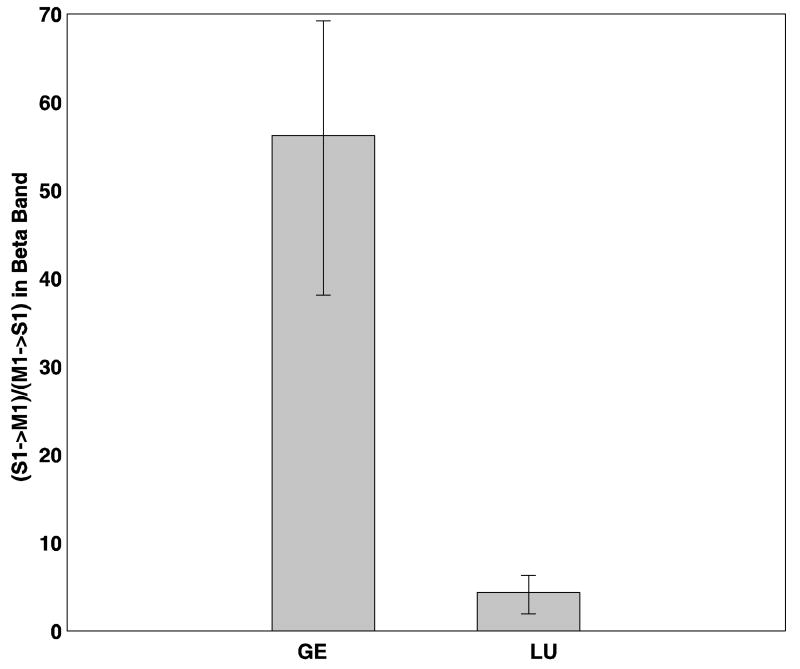
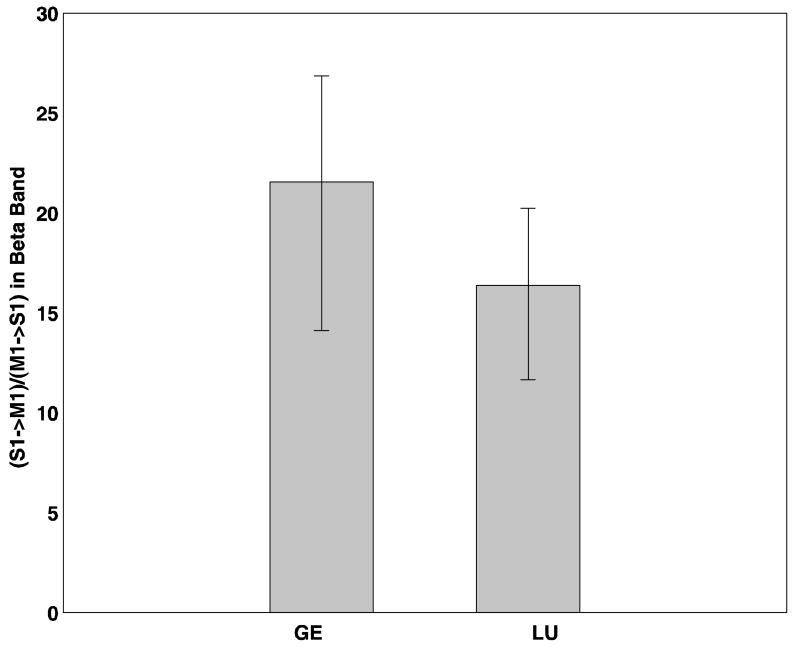
Neural data are inevitably contaminated by noise. When such noisy data are subjected to statistical analysis, misleading conclusions can be reached. Here we attempt to address this problem by applying a state-space smoothing method, based on the combined use of the Kalman filter theory and the Expectation-Maximization algorithm, to denoise two datasets of local field potentials recorded from monkeys performing a visuomotor task. For the first dataset, it was found that the analysis of the high gamma band (60-90 Hz) neural activity in the prefrontal cortex is highly susceptible to the effect of noise, and denoising leads to markedly improved results that were physiologically interpretable. For the second dataset, Granger causality between primary motor and primary somatosensory cortices was not consistent across two monkeys and the effect of noise was suspected. After denoising, the discrepancy between the two subjects was significantly reduced.
Figures
Similar articles
-
Mitigating the effects of measurement noise on Granger causality.Phys Rev E Stat Nonlin Soft Matter Phys. 2007 Mar;75(3 Pt 1):031123. doi: 10.1103/PhysRevE.75.031123. Epub 2007 Mar 29. Phys Rev E Stat Nonlin Soft Matter Phys. 2007. PMID: 17500684
-
Estimation of Vector Autoregressive Parameters and Granger Causality From Noisy Multichannel Data.IEEE Trans Biomed Eng. 2019 Aug;66(8):2231-2240. doi: 10.1109/TBME.2018.2885812. Epub 2018 Dec 18. IEEE Trans Biomed Eng. 2019. PMID: 30575525 Free PMC article.
-
Self-supervised structural similarity-based convolutional neural network for cardiac diffusion tensor image denoising.Med Phys. 2023 Oct;50(10):6137-6150. doi: 10.1002/mp.16301. Epub 2023 Apr 17. Med Phys. 2023. PMID: 36775901
-
Response preparation and inhibition: the role of the cortical sensorimotor beta rhythm.Neuroscience. 2008 Sep 22;156(1):238-46. doi: 10.1016/j.neuroscience.2008.06.061. Epub 2008 Jul 8. Neuroscience. 2008. PMID: 18674598 Free PMC article.
-
Assessing the strength of directed influences among neural signals: an approach to noisy data.J Neurosci Methods. 2015 Jan 15;239:47-64. doi: 10.1016/j.jneumeth.2014.09.007. Epub 2014 Sep 23. J Neurosci Methods. 2015. PMID: 25256644
Cited by
-
Assessing Granger Causality in Electrophysiological Data: Removing the Adverse Effects of Common Signals via Bipolar Derivations.Front Syst Neurosci. 2016 Jan 20;9:189. doi: 10.3389/fnsys.2015.00189. eCollection 2015. Front Syst Neurosci. 2016. PMID: 26834583 Free PMC article.
-
Improving the Process of Early-Warning Detection and Identifying the Most Affected Markets: Evidence from Subprime Mortgage Crisis and COVID-19 Outbreak-Application to American Stock Markets.Entropy (Basel). 2022 Dec 30;25(1):70. doi: 10.3390/e25010070. Entropy (Basel). 2022. PMID: 36673210 Free PMC article.
-
A Bayesian statistical analysis of behavioral facilitation associated with deep brain stimulation.J Neurosci Methods. 2009 Oct 15;183(2):267-76. doi: 10.1016/j.jneumeth.2009.06.028. Epub 2009 Jul 2. J Neurosci Methods. 2009. PMID: 19576932 Free PMC article.
-
Is Granger causality a viable technique for analyzing fMRI data?PLoS One. 2013 Jul 4;8(7):e67428. doi: 10.1371/journal.pone.0067428. Print 2013. PLoS One. 2013. PMID: 23861763 Free PMC article.
-
Estimation of cortical connectivity from EEG using state-space models.IEEE Trans Biomed Eng. 2010 Sep;57(9):2122-34. doi: 10.1109/TBME.2010.2050319. Epub 2010 May 24. IEEE Trans Biomed Eng. 2010. PMID: 20501341 Free PMC article.
References
-
- Albo Z, Viana Di Prisco G, Chen Y, Rangarajan G, Truccolo W, Feng J, Vertes RP, Ding M. Is partial coherence a viable technique for identifying generators of neural oscillations? Biol Cybern. 2004;90:318–26. - PubMed
-
- Bernasconi C, Konig P. On the directionality of cortical interactions studied by structural analysis of electrophysiological recordings. Biol Cybern. 1999;81:199–210. - PubMed
-
- Bernasconi C, Von Stein A, Chiang C, Konig P. Bi-directional interactions between visual areas in the awake behaving cat. NeuroReport. 2000;11:689–92. - PubMed
-
- Bressler SL, Coppola R, Nakamura R. Episodic multiregional cortical coherence at multiple frequencies during visual task performance. Nature. 1993;366:153–56. - PubMed
Publication types
MeSH terms
Grants and funding
LinkOut - more resources
Full Text Sources
