. 2009 May 15;179(2):191-200.
doi: 10.1016/j.jneumeth.2009.01.023. Epub 2009 Feb 4.

Acquiring local field potential information from amperometric neurochemical recordings

Affiliations

Acquiring local field potential information from amperometric neurochemical recordings

Hao Zhang et al. J Neurosci Methods. .

Abstract

Simultaneous acquisition of in vivo electrophysiological and neurochemical information is essential for understanding how endogenous neurochemicals modulate the dynamics of brain activity. However, up to now such a task has rarely been accomplished due to the major technical challenge of operating two independent recording systems simultaneously in real-time. Here we propose a simpler solution for achieving this goal by using only a standard electrochemical technique--amperometry. To demonstrate its feasibility, we compared amperometric signals with simultaneously recorded local field potential (LFP) signals. We found that the high frequency component (HFC) of the amperometric signals did not reflect neurochemical fluctuations, but instead it resembled LFPs in several aspects, including: (1) coherent spectral fluctuations; (2) clear characterization of different brain states; (3) identical hippocampal theta depth profile. As such, our findings provide the first demonstration that both LFP and local neurochemical information can be simultaneously acquired from electrochemical sensors alone.


Figures

Figure 1
Figure 1. Simultaneous recordings reveal similarity between high frequency LFP and amperometric signals
(A) An example of simultaneously recorded LFP (upper traces) and amperometric signals (lower traces) from contralateral hippocampi (shaded area in the schematic) in urethane-anesthetized rats. Three tail-pinches (*, delimited by purple lines), followed by carbachol injection into the medial septum (grey lines), were applied to modulate LFP and amperometric signals. The top expanded traces show signals at a finer temporal resolution upon pinch (left, purple arrow) and after carbachol injection (right). (B) High similarity between power spectrograms of the LFP (upper) and amperometric signals (lower). Log power values are color-coded with matched color scales (original signal unit, mV and nA, respectively). (C) High coherence at dominant frequency bands in different states between the example LFP and amperometric signals in (A). Only significant coherence is plotted (non-significant coherence in white). (D) Correlation coefficient of spectral power fluctuations at individual frequencies between LFP and amperometric signals, averaged across five experiments (mean ±s.e.m.). For illustration purpose, p-values smaller than 10-6 are set as 10-6. (E) Average power spectral density (PSD) for LFP and amperometric signals in the three different states (baseline, pinch and carbachol injection), normalized by the total power in that state (n=3 for baseline/pinch, mean ±s.e.m.; n=2 for carbachol injection, individual black lines). (F) Spectral indices calculated for baseline and pinch episodes were significantly different, in both LFP and amperometric recordings (**, p<0.001). Each line connects a pair of corresponding baseline and pinch episodes (six experiments, 17 trials). Amp, amperometry.
Figure 2
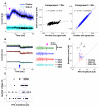
Figure 2. High frequency amperometric signals not affected by sensor modifications intended for neurochemical detection
(A) High frequency amperometric signals does not reflect choline fluctuations Left, Choline concentration increased by tail-pinch (purple arrow), as reflected in an increase in amperometric signals on the choline sensor site (blue), but not on the self-reference site (cyan). Black traces are low frequency (<1Hz) amperometric signals on the two sites, which were very weakly correlated (middle). In contrast, high frequency component (HFC, >1Hz) of amperometric signals on the two sites were almost proportional (right). (B) Similar LFP-like HFC signals also appeared on bare sensors. Left, raw amperometric signal on all four bare sites (black traces, signals < 1Hz). The lack of exclusion layer lead to very large baseline oxidation currents compared to those on the choline sensor in (A). The baseline oxidation current decreased when the probe was moved (blue arrow) from the hippocampus to the overlaying cortex, reflecting a change in local chemical composition. Right, HFC signals on the bare probes had amplitude comparable to that on the choline sensor in (A). The oscillation pattern of HFC signals also changed from delta to theta band upon pinch (purple arrow). (C) Comparison of amperometry HFC amplitude with baseline oxidation current. Each data point was obtained from a same recording site. Diagonal line indicates unity. Note that although the baseline current varied almost two orders of magnitude, the amplitude of the HFC remained stable regardless of enzyme coating and/or exclusion layer. (D) Individual values (black dots) and box-and-whisker plot for HFC amplitude at different amperometric voltages.
Figure 3
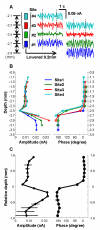
Figure 3. Hippocampal theta depth profile preserved in amperometry HFC
(A) An example of theta amplitude and phase during tail-pinch at different depths of the hippocampus. HFC signals were color-coded for the four sensor sites (200μm spacing). Numbers on the left indicated the depth below dura surface (mm). Note the different theta amplitude and phase (phase reversal emphasized by the dotted lines) across sites. As the sensor was lowered 200μm, theta amplitude and phase on each site (right) assumed the value of its immediate neighbor before being lowered (left). (B) HFC theta depth profile for the recording session in (A). Consistent with previous studies, there was a local amplitude minimum at -2.5mm below dura surface (stratum radiatum), and two local maxima at 2.1-2.3mm (stratum oriens) and at 3.0mm (hippocampal fissure) respectively. Phase reversal occurred just below -2.5mm. (C) Theta depth profile averaged for five experiments (mean ±s.e.m.), aligned according to the midpoint of theta phase reversal (defined as depth 0).
Figure 4
Figure 4. Physiological and pharmacologically-induced frequency signatures preserved in amperometry HFC signals recorded in free-moving rats
(A) Example spectrograms of simultaneously recorded LFP and amperometry HFC during waking (WK), slow-wave sleep (SWS) and rapid-eye-movement sleep (REM) in a free-moving rat (matched color scales). Note the similar spectral patterns in all sleep-wake states. (B) Normalized PSDs of LFPs recorded in MEA-implanted rats (upper, 5 rats, 5 sessions) and of HFC signals recorded in amperometric sensor-implanted rats (lower, 3 rats, 7 sessions). Lines and shaded area, mean ±s.e.m. (C) An example spectrogram of HFC signals showing a pronounced increase in theta power after amphetamine injection. (D) Normalized PSDs of the HFC before and after amphetamine injection in (C). Amp, amperometry.

References

    1. Bland BH, Whishaw IQ. Generators and topography of hippocampal theta (RSA) in the anaesthetized and freely moving rat. Brain Res. 1976;118:259–80. - PubMed
    1. Burmeister JJ, Palmer M, Gerhardt GA. Ceramic-based multisite microelectrode array for rapid choline measures in brain tissue. Analytica Chimica Acta. 2003;481:65–74.
    1. Burmeister JJ, Pomerleau F, Huettl P, Gash CR, Werner CE, Bruno JP, Gerhardt GA. Ceramic-based multisite microelectrode arrays for simultaneous measures of choline and acetylcholine in CNS. Biosens Bioelectron. 2008;23:1382–9. - PubMed
    1. Chang Q, Savage LM, Gold PE. Microdialysis measures of functional increases in ACh release in the hippocampus with and without inclusion of acetylcholinesterase inhibitors in the perfusate. J Neurochem. 2006 - PubMed
    1. Cheer JF, Heien ML, Garris PA, Carelli RM, Wightman RM. Simultaneous dopamine and single-unit recordings reveal accumbens GABAergic responses: implications for intracranial self-stimulation. Proc Natl Acad Sci U S A. 2005;102:19150–5. - PMC - PubMed

Publication types

MeSH terms