. 2009 May 15;179(2):300-8.
doi: 10.1016/j.jneumeth.2009.02.013. Epub 2009 Mar 4.

Quantitative evaluation of serotonin release and clearance in Drosophila

Affiliations

Quantitative evaluation of serotonin release and clearance in Drosophila

Xenia Borue et al. J Neurosci Methods. .

Abstract

Serotonin signaling plays a key role in the regulation of development, mood and behavior. Drosophila is well suited for the study of the basic mechanisms of serotonergic signaling, but the small size of its nervous system has previously precluded the direct measurements of neurotransmitters. This study demonstrates the first real-time measurements of changes in extracellular monoamine concentrations in a single larval Drosophila ventral nerve cord. Channelrhodopsin-2-mediated, neuronal type-specific stimulation is used to elicit endogenous serotonin release, which is detected using fast-scan cyclic voltammetry at an implanted microelectrode. Release is decreased when serotonin synthesis or packaging are pharmacologically inhibited, confirming that the detected substance is serotonin. Similar to tetanus-evoked serotonin release in mammals, evoked serotonin concentrations are 280-640nM in the fly, depending on the stimulation length. Extracellular serotonin signaling is prolonged after administering cocaine or fluoxetine, showing that transport regulates the clearance of serotonin from the extracellular space. When ChR2 is targeted to dopaminergic neurons, dopamine release is measured demonstrating that this method is broadly applicable to other neurotransmitter systems. This study shows that the dynamics of serotonin release and reuptake in Drosophila are analogous to those in mammals, making this simple organism more useful for the study of the basic physiological mechanisms of serotonergic signaling.


Figures

Fig 1
Fig 1
Characterization of evoked serotonin and dopamine signals. Blue light stimulation of isolated larval Drosophila VNCs elicits depolarization in neurons expressing ChR2. Left column: Color plots with dashed white line denoting oxidation potential utilized for signal trace. Duration of blue light exposure (10 s) indicated by blue bars. Color plots are scaled so the maximum oxidative current corresponds to 750 nM monoamine. Middle: The CVs verify the compound being detected. The CV from the fly (black line) is compared to that obtained during electrode calibration with 1 μM monoamine (blue line). The asterisks identify the oxidation and reduction peaks, which correspond to the green and blue areas in the color plots, respectively. Right: Signal traces show neurotransmitter concentration changes over time. Currents were converted to concentration based on electrode calibration values. (a–c) Serotonin release from a VNC expressing ChR2 under the control of Tph-GAL4. The color plot (a) and CV (b) exhibit serotonin-specific peaks as evident by the signal CVs match to the calibration CV. The signal trace (c) shows the serotonin peak is time-locked to the stimulus. Data from a control VNC lacking ChR2 expression shows minor fluctuations throughout the color plot (d) upon blue light exposure but the CV (e, black line) does not show any neurotransmitter specific peaks. (f) Trace shows a small error fluctuation in current.(g–i) Dopamine release from a VNC expressing ChR2 under the control of TH-GAL4. Note a different voltage waveform was used than for serotonin. The color plot (g) and CV (h) verify that dopamine was detected. Dopamine release is also time-locked to the stimulation (i). Data from a control VNC lacking ChR2 expression shows changes similar to those observed with the other waveform. Minor fluctuations are present at all voltages during the stimulation (j) but the CV (k) does not show any neurotransmitter specific peaks. (l) Trace shows a small fluctuation in current.
Fig. 2
Fig. 2
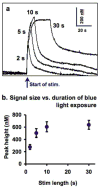
Evoked peak serotonin concentration varies with blue light stimulus duration. (a) Representative traces showing the effect of different stimulation lengths (2, 5, 10, and 30s) on peak height in the same sample. (b) Pooled data (mean +/− SEM, n = 6 samples) shows an increase in peak height with increasing duration of blue light exposure. Peak height appears to reach a plateau after 10s; peak height at 30s is not significantly different from that at 10s (p = 0.78, student t-test, 2 tailed).
Fig. 3
Fig. 3
Stability of serotonin signal. (a) Diagram of measured parameters. Peak height, which is the maximal concentration change from baseline, and time to half maximal signal decay (t50), which is the time from the end of the blue light stimulation until the signal decays to half its maximal value, were calculated. (b) Representative traces from same VNC showing repeated stimulations. All data are 10s long stimulations performed 10 min apart. (c,d) Pooled data (mean +/− SEM, n = 4) from VNCs dissected in buffer showing that t50 (c) and peak height (d) remain relatively stable over 8 stimulations repeated 10 min apart.
Fig. 4
Fig. 4
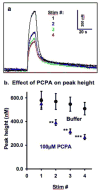
Effect of PCPA on serotonin release. When VNCs are dissected in the serotonin synthesis inhibitor PCPA, serotonin release decreases with repeated stimulation. All data is from 10 s long stimulations performed 10 min apart. (a) Representative traces from a VNC that has been incubated in PCPA, superimposed to show progressive decrease in peak height. (b) Pooled data (mean +/− SEM, n = 6) showing that peak height in PCPA incubated VNCs (triangles) decreases to 50 +/− 3% of initial value by the 4th stimulation. Asterisks indicate data are significantly different (** p < 0.01, *** p < 0.001, student t-test, 2 tailed) than samples incubated in buffer (circles).
Fig. 5
Fig. 5
Pharmacological characterization of serotonin release and clearance. VNCs were incubated in drugs for 30 minutes prior to the initiation of stimulation. (a) Representative trace from a VNC incubated in the VMAT inhibitor reserpine, superimposed on a trace from a control VNC that lacks ChR2 expression showing that they are similar in size and shape. (b) Representative traces from VNCs incubated in buffer, cocaine, or fluoxetine, superimposed to highlight differences in time course. (c, d) Pooled data (mean +/− SEM, n as shown). (c) Peak height is not affected by incubation in cocaine or fluoxetine (signal not different from buffer control group). Reserpine leads to a significant reduction in released serotonin (p<0.0001, student t-test, 2 tailed), with the signal size falling below the noise threshold (signal not significantly different from control VNC). (d) Cocaine and fluoxetine-incubated VNCs exhibit significantly longer time to half maximal signal decay (p < 0.0001, student t-test, two-tailed). Clearance measures were not performed for control or reserpine-incubated VNCs because serotonin was not detected.
Fig. 6
Fig. 6
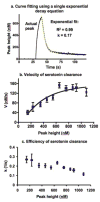
Kinetic parameters governing serotonin clearance. (a) Parameters can be calculated from the elicited serotonin peaks. The decay portion of the signal is fit with a one phase exponential decay curve. From this equation, k, the exponential constant is used to calculate an initial velocity (V). These parameters are shown (b, c) plotted against peak height (mean +/− SEM of 3–12 signals per point) (b) The initial velocity of serotonin clearance data were fit to a 4 parameter logistics equation (line). (c) The derived clearance decay rate (k) decreases as larger serotonin release is elicited.

References

    1. Bier E. Drosophila, the golden bug, emerges as a tool for human genetics. Nat Rev Genet. 2005;6:9–23. - PubMed
    1. Bruns D, Jahn R. Real-time measurement of transmitter release from single synaptic vesicles. Nature. 1995;377:62–65. - PubMed
    1. Bruns D, Riedel D, Klingauf J, Jahn R. Quantal release of serotonin. Neuron. 2000;28:205–220. - PubMed
    1. Bunin MA, Wightman RM. Quantitative evaluation of 5-hydroxytryptamine (serotonin) neuronal release and uptake: an investigation of extrasynaptic transmission. J Neurosci. 1998;18:4854–4860. - PMC - PubMed
    1. Chen J, Condron BG. Branch architecture of the fly larval abdominal serotonergic neurons. Dev Biol. 2008;320:30–38. - PMC - PubMed

Publication types

MeSH terms

LinkOut - more resources