

doi: 10.1128/JB.00717-08.
Epub 2009 May 8.
Interactions of DNA with biofilm-derived membrane vesicles
Affiliations
- PMID: 19429627
- PMCID: PMC2698485
- DOI: 10.1128/JB.00717-08
Item in Clipboard
Interactions of DNA with biofilm-derived membrane vesicles
J Bacteriol.
2009 Jul.
Abstract
The biofilm matrix contributes to the chemistry, structure, and function of biofilms. Biofilm-derived membrane vesicles (MVs) and DNA, both matrix components, demonstrated concentration-, pH-, and cation-dependent interactions. Furthermore, MV-DNA association influenced MV surface properties. This bears consequences for the reactivity and availability for interaction of matrix polymers and other constituents.
Figures
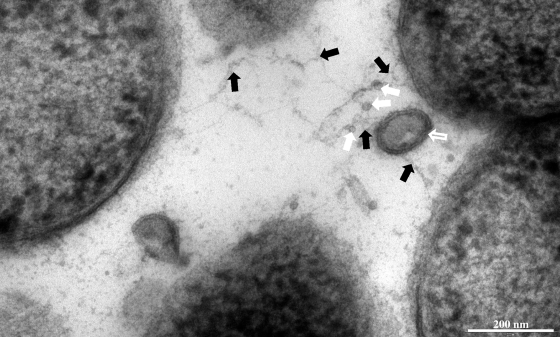
Possible interactions between matrix polymers and particulate structures. Shown is an electron micrograph of a thin section through a P. aeruginosa PAO1 biofilm. During processing, some dehydration occurred, resulting in collapse of matrix material into fibrillate arrangements (black filled arrows). There is a suggestion of interactions occurring with particulate structures such as MVs (hollow white arrow) and flagella (filled white arrows) (identified by the appearance and cross-dimension of these highly ordered structures when viewed at high magnification), which was consistently observed with other embedded samples and also with whole-mount preparations of gently disrupted biofilms (data not shown). The scale bar represents 200 nm.

DDAO staining of P. aeruginosa PAO1 biofilm revealed the presence of extracellular DNA. Areas where the DDAO stain indicated the presence of dsDNA (shown in red) were seen in between green fluorescent protein-tagged cells (shown in green) within the biofilm matrix. Note how the stain was not uniform. The presence of dsDNA was supported by biochemical assays with isolated matrix material (Table 1). The scale bar represents 4.69 μm.
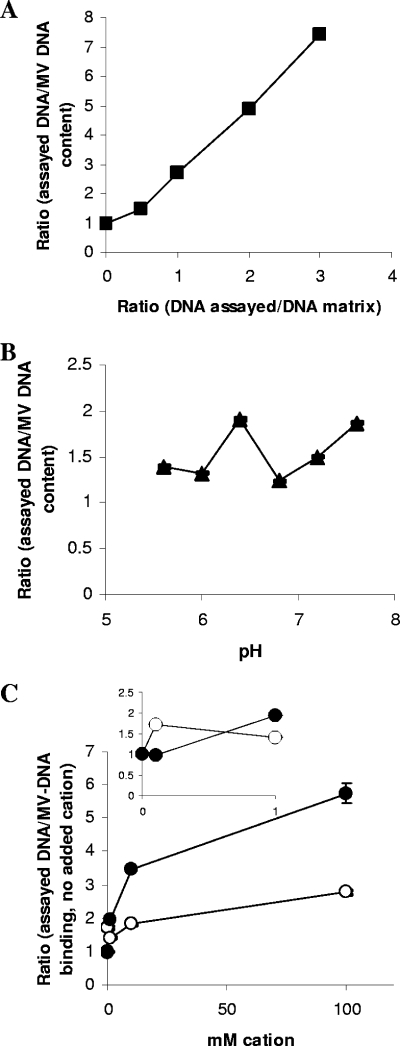
Assessment of the effect of environmental conditions upon the interaction between b-MVs and exogenous DNA. MVs were incubated with DNA (see Materials and Methods for details), and the effects of concentration of DNA (▪) (A), altered pH (▴) (B), and concentration of Na+ (○) or Mg2+ (•) cations, respectively (C), upon MV-DNA interactions were assessed. Note that for panel A, the ratio on the x axis is equal to the concentration of the assayed DNA/concentration of DNA in the matrix. Quantities of DNA (ng)/20 μg MV protein for R values of 1 were 116 ± 3 (DNA concentration; MVs only), 86 ± 3 (pH; MVs only), 275 ± 3 (Na+; MVs plus DNA only), and 236 ± 6 (Mg2+; MVs plus DNA only) (means ± standard deviations; n = 60).
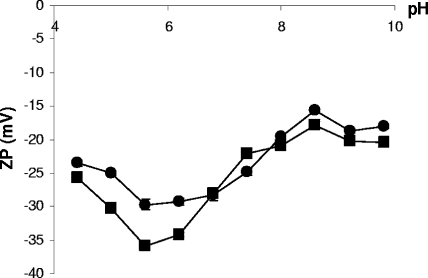
Relative surface charges of native and DNase-treated MVs. Suspensions of native MVs (▪) or DNase-treated MVs (•; 8 μg of MV protein·ml−1) were assessed by zeta potentiometry. Data for 10 and 100 mM buffer (not shown) yielded the expected concentration-dependent effect whereby an increase in buffer concentration causes a subsequent lessening of the apparent negative surface charge (mean ± SEM; n = 15). A two-tailed Mann-Whitney test was performed using Analyze-It for Microsoft Excel (version 2.11) and indicated that all data, with the exception of that collected at pH 6.8, showed highly significant differences (P < 0.01).
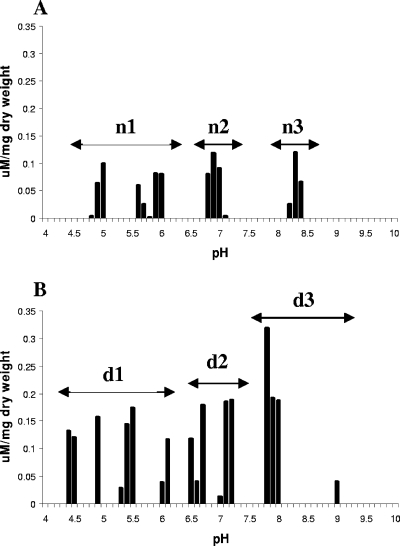
Titration analysis of the available functional groups present on the native and DNase-treated MVs. pKa spectra for native MVs (A) and DNase-treated MVs (B) composite plot of three spectra. The site density (concentration of ligand) is normalized to the dry weight of the sample used. The arrows (A, n1 to n3; B, d1 to d3) indicate the groups that the data cluster in. Please refer to Table 2 for details of these.
References
-
- Allesen-Holm, M., K. B. Barken, L. Yang, M. Klausen, J. S. Webb, S. Kjelleberg, S. Molin, M. Givskov, and T. Tolker-Nielsen. 2006. A characterization of DNA release in Pseudomonas aeruginosa cultures and biofilms. Mol. Microbiol. 591114-1128. - PubMed
-
- Beveridge, T. J., S. A. Makin, J. L. Kadurugamuwa, and Z. Li. 1997. Interactions between biofilms and the environment. FEMS Microbiol. Rev. 20291-303. - PubMed
-
- Böckelmann, U., A. Janke, R. Kuhn, T. R. Neu, J. Wecke, J. R. Lawrence, and U. Szewzyk. 2006. Bacterial extracellular DNA forming a defined network-like structure. FEMS Microbiol. Lett. 26231-38. - PubMed
Publication types
MeSH terms
Substances
LinkOut - more resources
Full Text Sources
Other Literature Sources
