. 2009 Jul 24;284(30):20349-63.
doi: 10.1074/jbc.M109.004580. Epub 2009 May 8.

A novel mitochondrial sphingomyelinase in zebrafish cells

Affiliations

A novel mitochondrial sphingomyelinase in zebrafish cells

Takeshi Yabu et al. J Biol Chem. .

Abstract

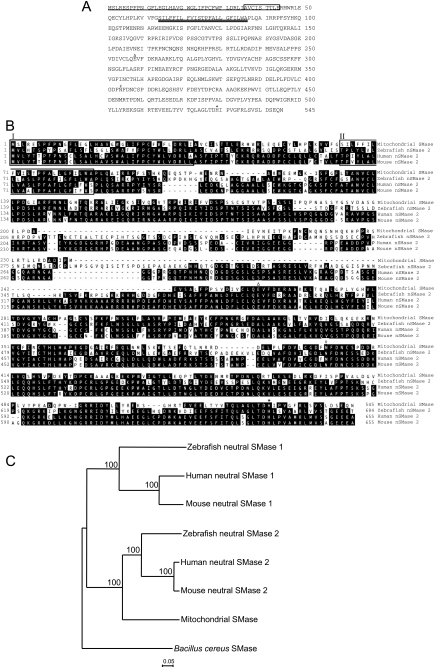
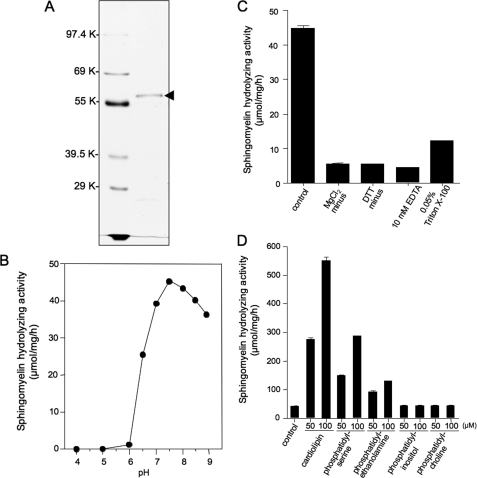
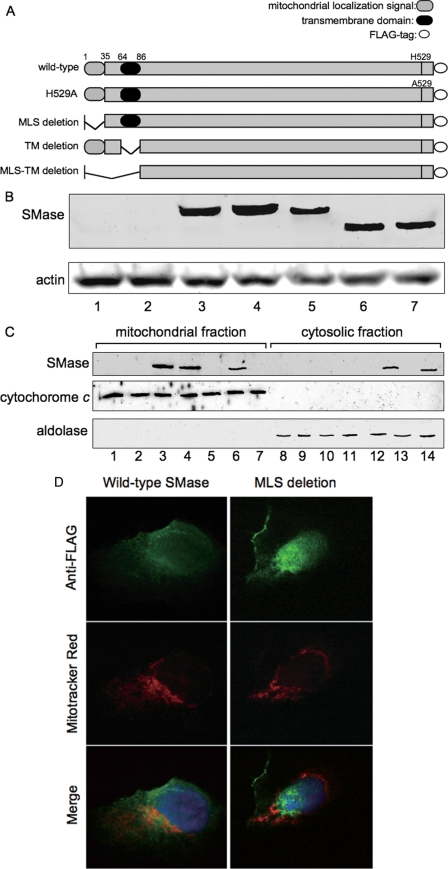
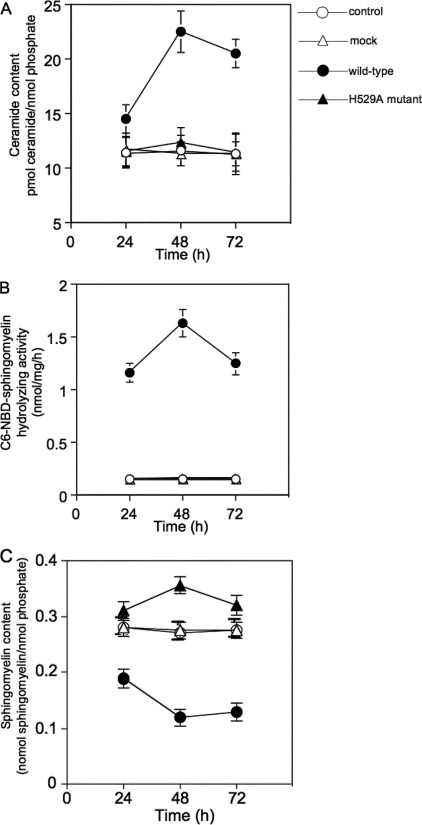
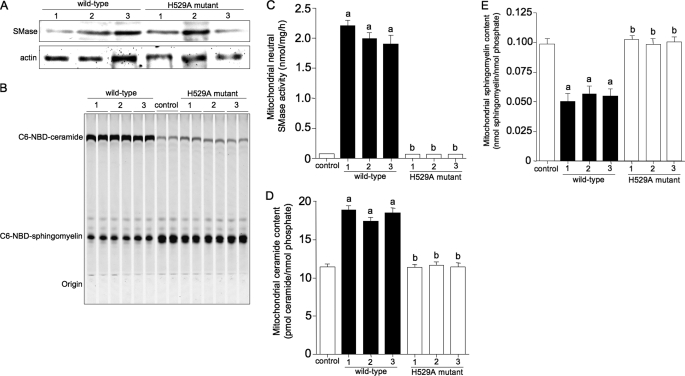
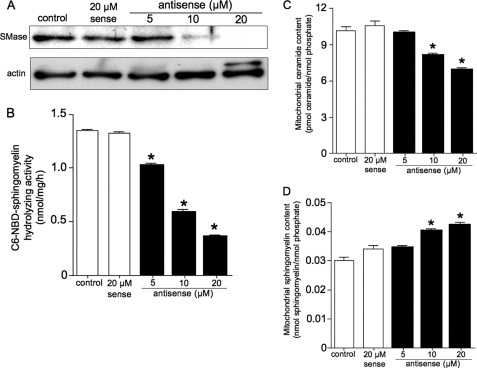
Sphingolipids are important signaling molecules in many biological processes, but little is known regarding their physiological roles in the mitochondrion. We focused on the biochemical characters of a novel sphingomyelinase (SMase) and its function in mitochondrial ceramide generation in zebrafish embryonic cells. The cloned SMase cDNA encoded a polypeptide of 545 amino acid residues (putative molecular weight, 61,300) containing a mitochondrial localization signal (MLS) and a predicted transmembrane domain. The mature endogenous enzyme was predicted to have a molecular weight of 57,000, and matrix-assisted laser de sorption ionization time-of-flight mass spectrometry analysis indicated that the N-terminal amino acid residue of the mature enzyme was Ala-36. The purified enzyme optimally hydrolyzed [(14)C]sphingomyelin in the presence of 10 mm Mg(2+) at pH 7.5. In HEK293 cells that overexpressed SMase cDNA, the enzyme was localized to the mitochondrial fraction, whereas mutant proteins lacking MLS or both the MLS and the transmembrane domain were absent from the mitochondrial fraction. Endogenous SMase protein co-localized with a mitochondrial cytostaining marker. Using a protease protection assay, we found that SMase was distributed throughout the intermembrane space and/or the inner membrane of the mitochondrion. Furthermore, the overexpression of SMase in HEK293 cells induced ceramide generation and sphingomyelin hydrolysis in the mitochondrial fraction. Antisense phosphorothioate oligonucleotide-induced knockdown repressed ceramide generation and sphingomyelin hydrolysis in the mitochondrial fraction in zebrafish embryonic cells. These observations indicate that SMase catalyzes the hydrolysis of sphingomyelin and generates ceramide in mitochondria in fish cells.


Figures

FIGURE 1.
FIGURE 1.
Amino acid sequence of zebrafish mitochondrial SMase and neutral SMase 2 and the phylogenetic relationship among vertebrate neutral SMases. A, deduced amino acid sequence of zebrafish mitochondrial SMase. Amino acid positions are shown on the right. The putative MLS identified by the SMART program is underlined. The N-terminal amino acid sequence from the purified mature enzyme, as determined by MALDI-TOF-MS, is boxed. The putative transmembrane domain identified by the SMART program is double underlined. The putative Mg2+-complexing glutamine residue (Δ), the asparagine residue involved in substrate binding (#), and the catalytic base histidine residue (*) are shown. B, amino acid sequence alignment for zebrafish mitochondrial SMase, zebrafish neutral SMase 2, human neutral SMase 2, and mouse neutral SMase 2. Proteins with significant amino acid sequence homology were identified using a FASTA search of the GenBankTM data base. The sequences of neutral SMases were aligned using the deduced amino acid sequences of homologous proteins from zebrafish mitochondrial SMase, zebrafish neutral SMase 2, human neutral SMase 2, and mouse neural SMase 2. The putative MLS is boxed (I). The putative transmembrane domain is also boxed (II). C, phylogenetic tree based on the amino acid sequences of the vertebrate neutral SMases. The phylogenetic analysis was performed using the neighbor-joining method in ClustalX. Numbers on the internal branches denote the bootstrap percentages of 1000 replicates. The scale indicates the evolutionary distance of one amino acid substitution per site. The amino acid sequences used in the analysis were obtained from the NCBI protein data base with the following accession numbers: B. cereus SMase (X12854); human neutral SMase 1 and SMase 2 (NM_009213 and AJ250460, respectively); mouse neutral SMase 1 and SMase 2 (NM_009213 and AJ250461, respectively); zebrafish neutral SMase 1 and SMase 2 (AB196165 and AB361067, respectively); and zebrafish mitochondrial SMase (AB361066).
FIGURE 2.
FIGURE 2.
Purification and characterization of the mitochondrial SMase from a zebrafish embryonic cell line. A, PAGE of purified enzyme. The arrowhead indicates the molecular mass of a 57-kDa protein. SDS-PAGE (10% gel) was performed after reduction of the sample. The gel was stained with Coomassie Brilliant Blue R-250. B, pH dependence of neutral SMase activity. The sphingomyelin hydrolyzing activity of the purified enzyme was measured at 37 °C for 30 min at various pH values, with an estimated optimum pH of 7.5. The pH was adjusted by the addition of the following buffers at a final concentration of 100 mm: acetate (pH 4 and 5), PIPES (pH 6, 6.5, and 7), and Tris (pH 7.5, 8, 8.5, and 9). C, effect of Mg2+ ions on neutral sphingomyelin hydrolyzing activity. The basal assay mixture contained 100 mm Tris-HCl (pH 7.5), 5 mm MgCl2, 0.1% Triton X-100, and 5 mm DTT. Effects of Mg2+ ion on the activity were measured in the presence of 10 mm EDTA. D, effect of lipids on mitochondrial SMase activity. The sphingomyelin hydrolyzing activity of the purified enzyme was determined under standard conditions in the presence of [14C]sphingomyelin under standard conditions and the indicated phospholipids (50 or 100 μm). The basal enzyme activity (control) was 45 ± 3 μmol/mg/h.
FIGURE 3.
FIGURE 3.
Subcellular localization and distribution of SMase. A, whole lysate of ZE cells (lane 1) was fractionated into the mitochondrial fraction (lane 2), cytosolic fraction (lane 3), and microsomal fraction (lane 4) via ultracentrifugation. These fractions were analyzed by Western blotting using antibodies against zebrafish mitochondrial SMase, HSP60 (a mitochondrial marker), aldolase (a cytosolic marker), and neutral SMase 1 and cadherin (cell membrane markers). B, The mitochondrial fraction was separated into eight fractions using the sucrose gradient ultracentrifugation. The separated proteins in each fraction were subjected to Western blotting using antibodies against zebrafish mitochondrial SMase, HSP60, and cytochrome c (a mitochondrial marker), KDEL protein (an endoplasmic reticulum marker), 58-kDa protein (a Golgi marker), cathepsin L (a lysosomal marker), and catalase (peroxisomal marker), and neutral SMase activities in each fraction were determined. The lysosomal marker, endoplasmic reticulum marker, and Golgi marker, mitochondrial marker, or peroxisomal marker were detected in the fraction numbers 1 and 2, fraction numbers 4–6, and fraction numbers 7 and 8, respectively. C, specific activities of marker enzymes in subcellular fractionation of ZE cells. The C6-NBD-sphingomyelin hydrolyzing activities of the SMase, mitochondrial cytochrome c oxidase, endoplasmic reticulum cytochrome c reductase, and lysosomal acid phosphatase were measured in each fraction by subcellular fractionation. Values and bars indicate the mean ± S.D. of three independent experiments. D, ZE cells were fixed and permeabilized with 0.1% Triton X-100. The cells were incubated with 100 nm MitoTracker Red and then fixed with 4% paraformaldehyde in PBS. The cells were co-stained with anti-zebrafish SMase antibody and an antibody against either HSP60 protein (a mitochondria marker) or KDEL protein (an endoplasmic reticulum marker) and stained with fluorescent secondary antibodies. Signals for SMase (green color image) and signals for subcellular markers such as mitochondria and endoplasmic reticulum (red color image) were observed. The overlay images indicate the SMase, and the subcellular markers were co-localized either in the sample place or adjacent to one another as described under “Experimental Procedures.” Scale bar, 10 μm. E, distribution of SMase in the mitochondrion. Mitochondrial fractions were obtained from a zebrafish embryonic cell line and incubated at 0 °C for 30 min in the absence (lane 1) or presence (lanes 2–4) of proteinase K, and under swelling condition (20 mm HEPES-NaOH (pH 7.4), 10 mm sodium orthovanadate, 20 mm NaF, 250 mm sucrose, 2 mm CaCl2) (lanes 3 and 4) or in the presence (lane 4) of Triton X-100. The samples were subjected to Western blotting with anti-mitochondrial SMase, anti-cytochrome c, and anti-HSP60 antibodies.
FIGURE 4.
FIGURE 4.
Mitochondrial localization of SMase variants. A, schematic representation of SMase constructs. B, HEK293 cells were transiently transfected with their constructs alone. Lane 1, control; lane 2, mock; lane 3, wild type; lane 4, H529A mutant; lane 5, MLS deletion mutant; lane 6, TM deletion mutant; lane 7, MLS-TM deletion mutant. At 48 h after transfection, the expressed proteins were detected using anti-FLAG antibody or anti-actin via Western blotting as described under “Experimental Procedures.” C, HEK293 cells expressing the indicated constructs were fractionated into mitochondrial (lanes 1–7) and cytosolic (lanes 8–14) fractions, and each fraction was analyzed by Western blotting using antibodies against FLAG, SMase, cytochrome c, and aldolase. Lanes 1 and 8, control; lanes 2 and 9, mock; lanes 3 and 10, wild type; lanes 4 and 11, H529A mutant; lanes 5 and 12, MLS deletion mutant; lanes 6 and 13, TM deletion mutant; lanes 7 and 14, MLS-TM deletion mutant. D, mitochondrial localization of the wild-type construct. The HEK293 cells transfected with wild type of SMase and MLS deletion mutant were incubated with 25 nm MitoTracker Red and fixed with 4% paraformaldehyde in PBS. The cells were co-stained with anti-FLAG antibody. Signals for zebrafish SMase with FLAG tag (green color image) and signals for mitochondrial marker (red color image) and the overlay images (merge) were observed as described under “Experimental Procedures.”
FIGURE 5.
FIGURE 5.
Ceramide and sphingomyelin levels in association with neutral SMase activity in SMase transfectants. Cellular lipids were extracted at the indicated times after transfection. The levels of ceramide (A) and sphingomyelin (C) were quantified using the diacylglycerol kinase assay and phosphate measurement after TLC separation, respectively. The cells were lysed, and C6-NBD-sphingomyelin hydrolyzing activity (B) was determined as described under “Experimental Procedures.” Values and bars indicate the mean ± S.D. of three independent experiments.
FIGURE 6.
FIGURE 6.
Increase in neutral SMase activity with increased ceramide and decreased sphingomyelin levels in the mitochondrial fraction of SMase transfectants. HEK293 cells were stably transfected with the wild-type or H529A mutant construct. Three wild-type and three H529A mutant lines were established as described under “Experimental Procedures.” The expressed proteins in each group of three lines (A) were detected via Western blotting using anti-FLAG antibody as described under “Experimental Procedures.” B, neutral SMase activity against C6-NBD-sphingomyelin in the mitochondrial fraction was demonstrated via TLC separation and visualized by UV irradiation at 254 nm. C, increase in neutral SMase activity in wild-type cell lines. The cells were lysed, and C6-NBD-sphingomyelin hydrolyzing activity was determined as described under “Experimental Procedures.” D, increasing ceramide content in the mitochondrial fraction isolated from three wild-type lines. E, decreasing sphingomyelin content in the mitochondrial fraction isolated from three wild-type lines. Cellular lipids in the mitochondrial fraction were extracted, and the levels of ceramide and sphingomyelin were quantified using the diacylglycerol kinase assay and phosphate measurement, respectively. Values and bars indicate the mean ± S.D. of three independent experiments. Different letters denote a statistical difference between wild-type and H529A mutant cells (p < 0.01).
FIGURE 7.
FIGURE 7.
Antisense oligonucleotides against mitochondrial SMase protein inhibit ceramide generation. ZE cells were pretreated with 0–20 μm antisense or 20 μm sense oligonucleotides against mitochondrial SMase for 48 h. A, expressed proteins in oligonucleotide-treated cells were detected with anti-mitochondrial SMase or anti-actin antibodies by Western blotting, as described under “Experimental Procedures.” B, C6-NBD-sphingomyelin hydrolyzing activity; C, ceramide content; and D, sphingomyelin content in the mitochondrial fractions. Values and bars indicate the mean ± S.D. of three independent experiments. *, p < 0.01 versus sense oligonucleotide-treated cells.

Similar articles

Cited by

References

    1. Hannun Y. A., Luberto C. (2000) Trends Cell Biol. 10, 73–80 - PubMed
    1. Levade T., Malagarie-Cazenave S., Gouazé V., Ségui B., Tardy C., Betito S., Andrieu-Abadie N., Cuvillier O. (2002) Neurochem. Res. 27, 601–607 - PubMed
    1. Marchesini N., Hannun Y. A. (2004) Biochem. Cell Biol. 82, 27–44 - PubMed
    1. Obeid L. M., Linardic C. M., Karolak L. A., Hannun Y. A. (1993) Science 259, 1769–1771 - PubMed
    1. Okazaki T., Bell R. M., Hannun Y. A. (1989) J. Biol. Chem. 264, 19076–19080 - PubMed

Publication types

MeSH terms

Associated data