Comparative Study
. 2009 Jul;37(12):4063-75.
doi: 10.1093/nar/gkp276. Epub 2009 May 8.

Stochastic sampling of the RNA structural alignment space

Affiliations
Comparative Study

Stochastic sampling of the RNA structural alignment space

Arif Ozgun Harmanci et al. Nucleic Acids Res. 2009 Jul.

Abstract

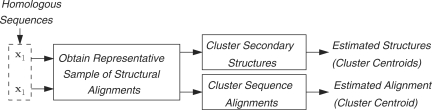
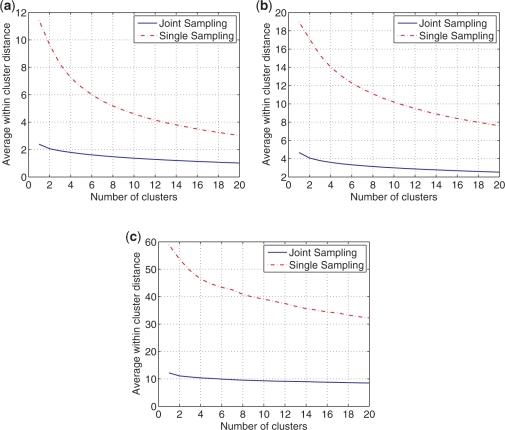
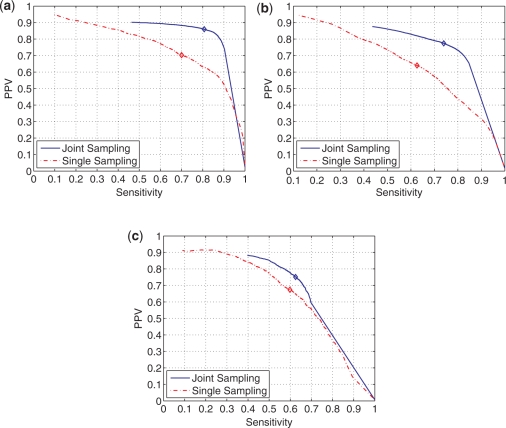
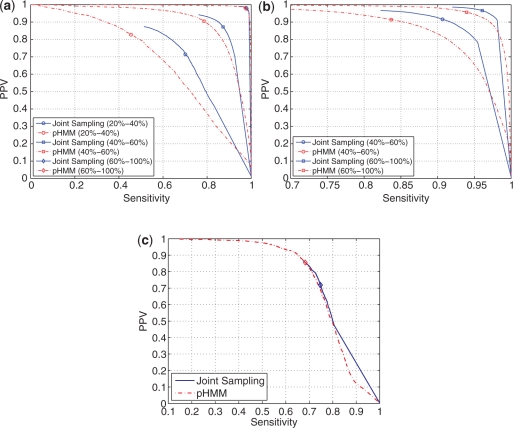
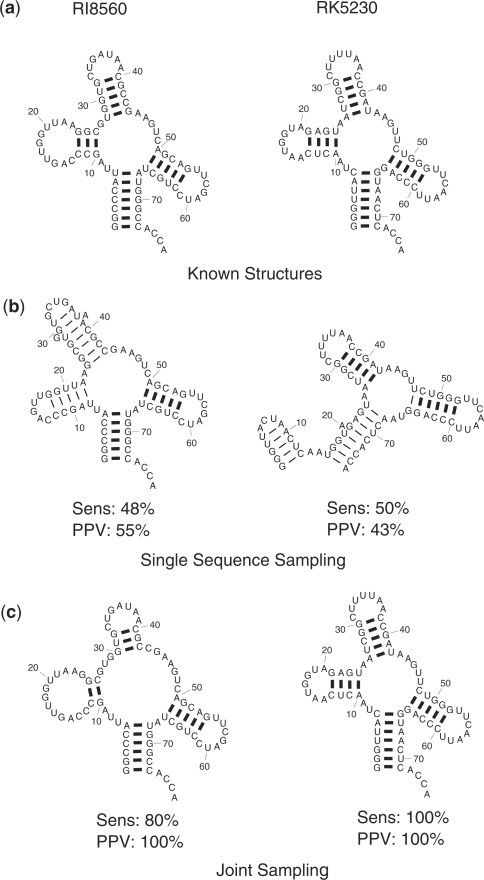
A novel method is presented for predicting the common secondary structures and alignment of two homologous RNA sequences by sampling the 'structural alignment' space, i.e. the joint space of their alignments and common secondary structures. The structural alignment space is sampled according to a pseudo-Boltzmann distribution based on a pseudo-free energy change that combines base pairing probabilities from a thermodynamic model and alignment probabilities from a hidden Markov model. By virtue of the implicit comparative analysis between the two sequences, the method offers an improvement over single sequence sampling of the Boltzmann ensemble. A cluster analysis shows that the samples obtained from joint sampling of the structural alignment space cluster more closely than samples generated by the single sequence method. On average, the representative (centroid) structure and alignment of the most populated cluster in the sample of structures and alignments generated by joint sampling are more accurate than single sequence sampling and alignment based on sequence alone, respectively. The 'best' centroid structure that is closest to the known structure among all the centroids is, on average, more accurate than structure predictions of other methods. Additionally, cluster analysis identifies, on average, a few clusters, whose centroids can be presented as alternative candidates. The source code for the proposed method can be downloaded at http://rna.urmc.rochester.edu.


Figures

Figure 1.
Figure 1.
Block diagram showing processing steps of samples of structures and alignments obtained from the joint sampling of structural alignment space.
Figure 2.
Figure 2.
Structural alignment of RD0260 and RD0500. Colored rectangles indicate the nucleotides in matched helical regions (25). (a) Common secondary structures. (b) Sequence alignment.
Figure 3.
Figure 3.
Decomposition of a structural alignment of two hypothetical sequences into SAAs. (a) The structures of sequences x1 and x2. The bold lines represent the base pairing between nucleotides at corresponding indices. (b) The sequence alignment A between sequences. The aligned nucleotides are denoted by lines with double-headed arrows. A bold line in a sequence represents an insertion at the corresponding index in the other sequence. The dashed rectangles illustrate decomposition of the structural alignment into eight SAAs that are denoted by χn(i, j, k, l), n = 1, … , 8, such that each dashed rectangle encloses the nucleotide indices whose pairing and alignment are defined by the respective SAA. For the SAA χ3(2, 9, 3, 9), the internal and external SAAs are illustrated in (a) by the arrows on left and in (b) by grouping of corresponding SAAs.
Figure 4.
Figure 4.
Average within cluster base pair distance for clusters of sampled structures. (a) tRNA. (b) 5S rRNA. (c) RNase P.
Figure 5.
Figure 5.
Plot of sensitivity versus PPV of paired bases with estimated pairing probability (by joint and single sequence sampling methods) greater than a probability threshold while threshold probability ranges from 0.0 to 1.0. The diamonds on each curve denote the sensitivity and PPV values when the threshold probability is 0.50. (a) tRNA. (b) 5S rRNA. (c) RNase P.
Figure 6.
Figure 6.
Sensitivity versus PPV of aligned nucleotide positions with posterior probability of alignment (as computed by joint sampling and pHMM methods) greater than a threshold probability while threshold probability ranges from 0.0 to 1.0 for (a) tRNA, (b) 5S rRNA, and (c) RNase P datasets. The sequence pairs in tRNA and 5S rRNA datasets are stratified by sequence similarity ranging from 20% to 100% and corresponding results are plotted in (a) and (b). The average pairwise identity for tRNA dataset is 0.496, 5S rRNA dataset is 0.641 and RNase P dataset is 0.528. A marker on a curve denotes the accuracy of aligned positions when threshold probability is 0.50.
Figure 7.
Figure 7.
The biggest cluster centroid structures of tRNA sequences RI8560 and RK5230 computed from sample of 1000 structures generated by single sequence sampling and joint sampling. (a) Known structures of each sequence. (b) Centroid of the most populated cluster for single sequence sampling. (c) Centroids of the most populated cluster for joint sampling of the sequences. The sensitivity and PPV of each centroid is shown by “Sens” and “PPV” respectively below the structure.

References

    1. Mattick JS, Makunin IV. Non-coding RNA. Hum. Mol. Genet. 2006;15:17–29. - PubMed
    1. Pace NR, Thomas BC, Woese CR. The RNA World. 2nd. New York: Cold Spring Harbor Laboratory Press; 1999. Probing RNA structure, function and history by comparative analysis; pp. 113–141.
    1. Gutell RR, Lee JC, Cannone JJ. The accuracy of ribosomal RNA comparative structure models. Curr. Opin. in Struct. Biol. 2002;12:301–310. - PubMed
    1. Mathews DH, Disney MD, Childs JL, Schroeder SJ, Zuker M, Turner DH. Incorporating chemical modification constraints into a dynamic programming algorithm for prediction of RNA secondary structure. Proc. Natl Acad. Sci. USA. 2004;101:7287–7292. - PMC - PubMed
    1. Xia T, SantaLucia JJ, Kierzek R, Schroeder SJ, Jiao X, Cox C, Turner DH. Thermodynamic parameters for an expanded nearest-neighbor model for formation of RNA duplexes with Watson-Crick pairs. Biochemistry. 1998;37:14719–14735. - PubMed

Publication types