

Antitumorigenesis of antioxidants in a transgenic Rac1 model of Kaposi's sarcoma
- PMID: 19429708
- PMCID: PMC2679580
- DOI: 10.1073/pnas.0812688106
Antitumorigenesis of antioxidants in a transgenic Rac1 model of Kaposi's sarcoma
Abstract
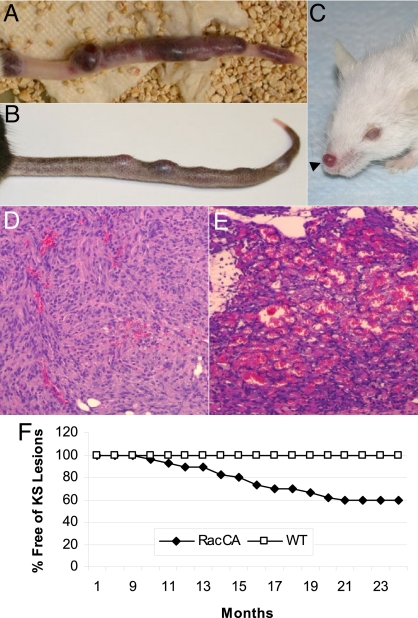
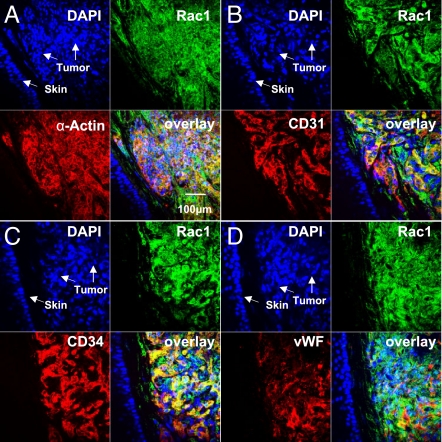
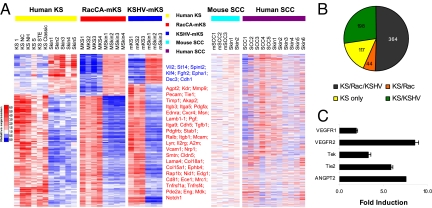
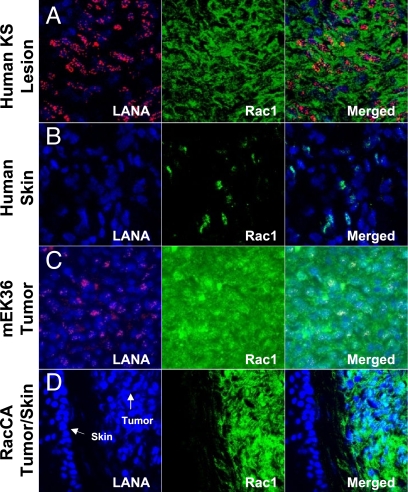
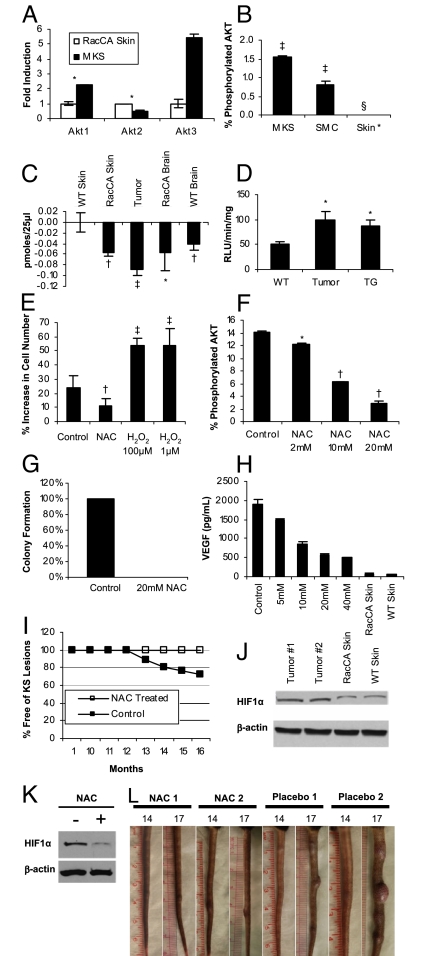
Kaposi's sarcoma (KS) is the major AIDS-associated malignancy. It is characterized by the proliferation of spindle cells, inflammatory infiltrate, and aberrant angiogenesis caused by Kaposi's sarcoma herpesvirus (KSHV) infection. Small GTPase Rac1, an inflammatory signaling mediator triggering reactive oxygen species (ROS) production by NADPH-oxidases, is implicated in carcinogenesis and tumor angiogenesis. Here, we show that expression of a constitutively active Rac1 (RacCA) driven by the alpha-smooth muscle actin promoter in transgenic mice is sufficient to cause KS-like tumors through mechanisms involving ROS-driven proliferation, up-regulation of AKT signaling, and hypoxia-inducible factor 1-alpha-related angiogenesis. RacCA-induced tumors expressed KS phenotypic markers; displayed remarkable transcriptome overlap with KS lesions; and were, like KS, associated with male gender. The ROS scavenging agent N-acetyl-cysteine inhibited angiogenesis and completely abrogated transgenic RacCA tumor formation, indicating a causal role of ROS in tumorigenesis. Consistent with a pathogenic role in KS, immunohistochemical analysis revealed that Rac1 is overexpressed in KSHV(+) spindle cells of AIDS-KS biopsies. Our results demonstrate the direct oncogenicity of Rac1 and ROS and their contribution to a KS-like malignant phenotype, further underscoring the carcinogenic potential of oxidative stress in the context of chronic infection and inflammation. They define the RacCA transgenic mouse as a model suitable for studying the role of oxidative stress in the pathogenesis and therapy of KS, with relevance to other inflammation-related malignancies. Our findings suggest host and viral genes triggering Rac1 or ROS production as key determinants of KS onset and potential KS chemopreventive or therapeutic targets.
Conflict of interest statement
The authors declare no conflict of interest.
Figures
Comment in
-
Studying Rac1-induced tumorigenesis suggests antioxidants may help prevent and treat Kaposi's sarcoma.Future Oncol. 2009 Sep;5(7):949-52. doi: 10.2217/fon.09.83. Future Oncol. 2009. PMID: 19792964 No abstract available.
Similar articles
-
A role for virally induced reactive oxygen species in Kaposi's sarcoma herpesvirus tumorigenesis.Antioxid Redox Signal. 2013 Jan 1;18(1):80-90. doi: 10.1089/ars.2012.4584. Epub 2012 Aug 20. Antioxid Redox Signal. 2013. PMID: 22746102 Free PMC article.
-
Synergy between Kaposi's sarcoma-associated herpesvirus (KSHV) vIL-6 and HIV-1 Nef protein in promotion of angiogenesis and oncogenesis: role of the AKT signaling pathway.Oncogene. 2014 Apr 10;33(15):1986-96. doi: 10.1038/onc.2013.136. Epub 2013 Apr 22. Oncogene. 2014. PMID: 23604117
-
KSHV induces aerobic glycolysis and angiogenesis through HIF-1-dependent upregulation of pyruvate kinase 2 in Kaposi's sarcoma.Angiogenesis. 2015 Oct;18(4):477-88. doi: 10.1007/s10456-015-9475-4. Epub 2015 Jun 20. Angiogenesis. 2015. PMID: 26092770 Free PMC article.
-
Molecular studies and therapeutic targeting of Kaposi's sarcoma herpesvirus (KSHV/HHV-8) oncogenesis.Immunol Res. 2013 Dec;57(1-3):159-65. doi: 10.1007/s12026-013-8458-z. Immunol Res. 2013. PMID: 24203444 Free PMC article. Review.
-
Pathogenesis of AIDS-associated Kaposi's sarcoma.Hematol Oncol Clin North Am. 1991 Apr;5(2):281-95. Hematol Oncol Clin North Am. 1991. PMID: 2022594 Review.
Cited by
-
Rhein Derivative 4F Inhibits the Malignant Phenotype of Breast Cancer by Downregulating Rac1 Protein.Front Pharmacol. 2020 May 28;11:754. doi: 10.3389/fphar.2020.00754. eCollection 2020. Front Pharmacol. 2020. PMID: 32547389 Free PMC article.
-
xCT, not just an amino-acid transporter: a multi-functional regulator of microbial infection and associated diseases.Front Microbiol. 2015 Feb 19;6:120. doi: 10.3389/fmicb.2015.00120. eCollection 2015. Front Microbiol. 2015. PMID: 25745420 Free PMC article.
-
Singlet oxygen treatment of tumor cells triggers extracellular singlet oxygen generation, catalase inactivation and reactivation of intercellular apoptosis-inducing signaling.Redox Biol. 2015 Dec;6:157-168. doi: 10.1016/j.redox.2015.07.006. Epub 2015 Jul 17. Redox Biol. 2015. PMID: 26225731 Free PMC article.
-
High-throughput sequencing analysis of a "hit and run" cell and animal model of KSHV tumorigenesis.PLoS Pathog. 2020 Jun 30;16(6):e1008589. doi: 10.1371/journal.ppat.1008589. eCollection 2020 Jun. PLoS Pathog. 2020. PMID: 32603362 Free PMC article.
-
Herpesvirus-encoded GPCRs: neglected players in inflammatory and proliferative diseases?Nat Rev Drug Discov. 2014 Feb;13(2):123-39. doi: 10.1038/nrd4189. Epub 2014 Jan 21. Nat Rev Drug Discov. 2014. PMID: 24445563 Review.
References
-
- Gallo RC. The enigmas of Kaposi's sarcoma. Science. 1998;282:1837–1839. - PubMed
-
- Boshoff C, Weiss RA. Kaposi's sarcoma-associated herpesvirus. Adv Cancer Res. 1998;75:57–86. - PubMed
-
- Ganem D. KSHV and Kaposi's sarcoma: The end of the beginning? Cell. 1997;91:157–160. - PubMed
-
- Mitsuyasu RT. AIDS-related Kaposi's sarcoma: Current treatment options, future trends. Oncology (Huntingt) 2000;14:867–878. discussion 878, 881–883, 887. - PubMed
-
- Bais C, Santomasso B, Coso O, et al. G-protein-coupled receptor of Kaposi's sarcoma-associated herpesvirus is a viral oncogene and angiogenesis activator. Nature. 1998;391:86–89. - PubMed
Publication types
MeSH terms
Substances
Grants and funding
LinkOut - more resources
Full Text Sources
Medical
Molecular Biology Databases
Research Materials
