. 2009 Jun;37(11):e79.
doi: 10.1093/nar/gkp310. Epub 2009 May 8.

Text-based over-representation analysis of microarray gene lists with annotation bias

Affiliations

Text-based over-representation analysis of microarray gene lists with annotation bias

Hui Sun Leong et al. Nucleic Acids Res. 2009 Jun.

Abstract

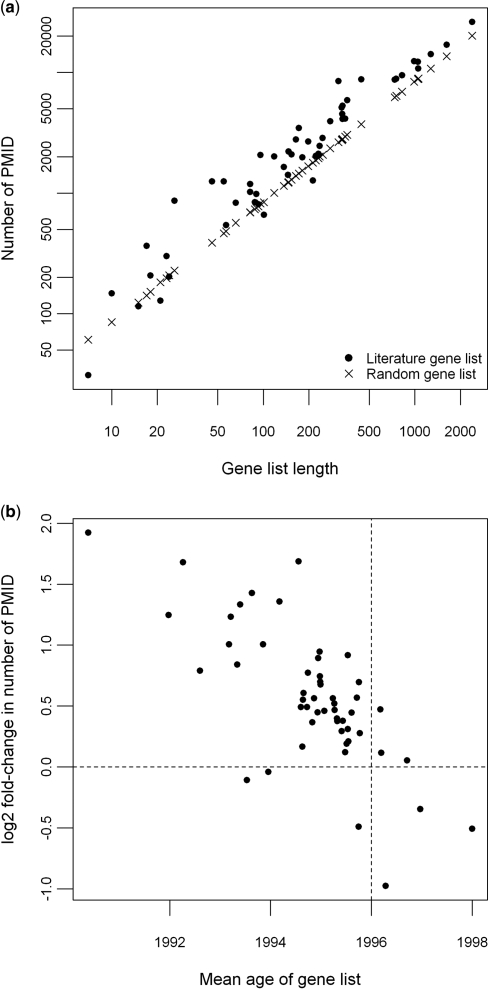
A major challenge in microarray data analysis is the functional interpretation of gene lists. A common approach to address this is over-representation analysis (ORA), which uses the hypergeometric test (or its variants) to evaluate whether a particular functionally defined group of genes is represented more than expected by chance within a gene list. Existing applications of ORA have been largely limited to pre-defined terminologies such as GO and KEGG. We report our explorations of whether ORA can be applied to a wider mining of free-text. We found that a hitherto underappreciated feature of experimentally derived gene lists is that the constituents have substantially more annotation associated with them, as they have been researched upon for a longer period of time. This bias, a result of patterns of research activity within the biomedical community, is a major problem for classical hypergeometric test-based ORA approaches, which cannot account for such bias. We have therefore developed three approaches to overcome this bias, and demonstrate their usability in a wide range of published datasets covering different species. A comparison with existing tools that use GO terms suggests that mining PubMed abstracts can reveal additional biological insight that may not be possible by mining pre-defined ontologies alone.


Figures

Figure 1.
Figure 1.
The relationship between annotation bias and gene age. (a) 52 gene lists from the HG-U133A chip were collated from published literature and for each of these equivalently sized random gene lists were created. The numbers of PMIDs associated with them were calculated and plotted against the size of the gene lists. Both axes are on logarithmic scale. (b) A mean age was calculated for each of the 52 literature gene lists by averaging the consensus ages of its constituent genes. Fold-change in PMID was calculated by dividing the number of PMIDs associated with a literature gene list by the average PMID count in an equivalently sized random gene list. The vertical dashed line represents the mean age of a random gene list, which is 1996 in this case; the horizontal dashed line represents the level at which there is no difference between the numbers of PMIDs associated with the literature and random gene lists.
Figure 2.
Figure 2.
A scatter plot of Chip versus List frequencies for tokens in the ISG gene list. Each data point represents an abstract term. Terms that were identified as significantly enriched (i.e. Bonferroni P ≤ 0.05) in the ISG gene list by using the Outlier method are circled and the adjacent numbers corresponding to their rankings. Chip (y-axis) represents the number of genes associated with each term on the whole chip. List (x-axis) represents the number of genes associated with each term in the ISG gene list. The log 2-transformed List and Chip frequencies are plotted.
Figure 3.
Figure 3.
A comparison of the performance of Outlier (a) and ExtendedHG (b) across different species. The average number of tokens called significant by the two approaches, Outlier and ExtendedHG, is plotted against the annotation density (i.e. number of PMID per gene) for experimentally derived gene lists that were performed on 10 Affymetrix platforms representing eight different species, including HG-U133A (hsa), HG-U133 Plus 2.0 (hum), Mouse 430 2.0 (mou), Rat 230 2.0 (rat), Arabidopsis ATH1 (ath); DrosGenome1 (dm), Drosophila 2.0 (dros), Xenopus laevis (xl), C. elegans (ce) and Zebrafish (dr).

References

    1. Hosack DA, Dennis G, Jr, Sherman BT, Lane HC, Lempicki RA. Identifying biological themes within lists of genes with EASE. Genome Biol. 2003;4:R70. - PMC - PubMed
    1. Al Shahrour F, Diaz-Uriarte R, Dopazo J. FatiGO: a web tool for finding significant associations of Gene Ontology terms with groups of genes. Bioinformatics. 2004;20:578–580. - PubMed
    1. Dahlquist KD, Salomonis N, Vranizan K, Lawlor SC, Conklin BR. GenMAPP, a new tool for viewing and analyzing microarray data on biological pathways. Nat Genet. 2002;31:19–20. - PubMed
    1. Zeeberg BR, Feng W, Wang G, Wang MD, Fojo AT, Sunshine M, Narasimhan S, Kane DW, Reinhold WC, Lababidi S, et al. GoMiner: a resource for biological interpretation of genomic and proteomic data. Genome Biol. 2003;4:R28. - PMC - PubMed
    1. Draghici S, Khatri P, Bhavsar P, Shah A, Krawetz SA, Tainsky MA. Onto-Tools, the toolkit of the modern biologist: Onto-Express, Onto-Compare, Onto-Design and Onto-Translate. Nucleic Acids Res. 2003;31:3775–3781. - PMC - PubMed

Publication types