. 2009 Aug;8(8):1908-20.
doi: 10.1074/mcp.M800559-MCP200. Epub 2009 May 9.

Systems-wide analysis of a phosphatase knock-down by quantitative proteomics and phosphoproteomics

Affiliations

Systems-wide analysis of a phosphatase knock-down by quantitative proteomics and phosphoproteomics

Maximiliane Hilger et al. Mol Cell Proteomics. 2009 Aug.

Abstract

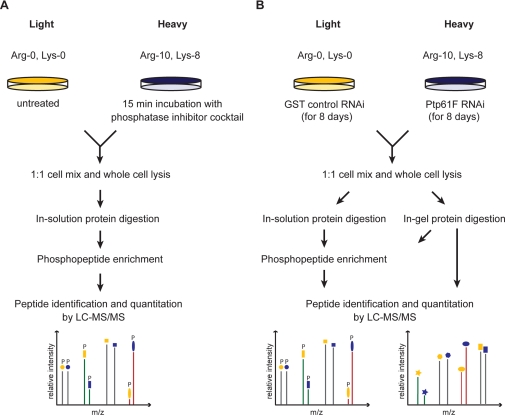
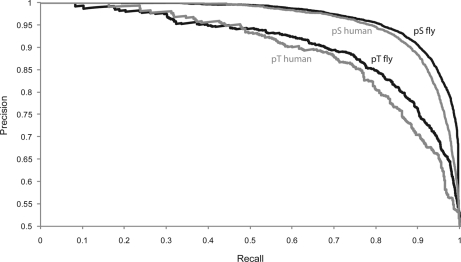
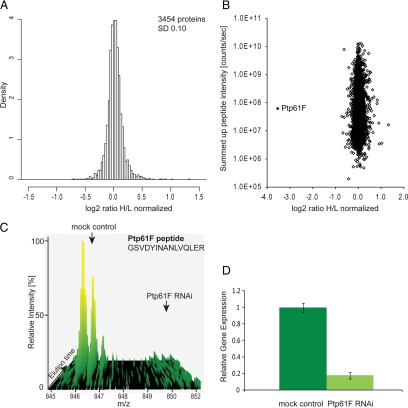
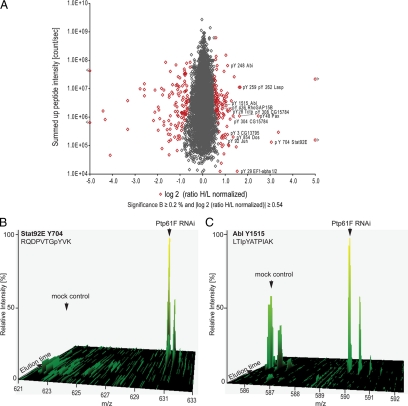
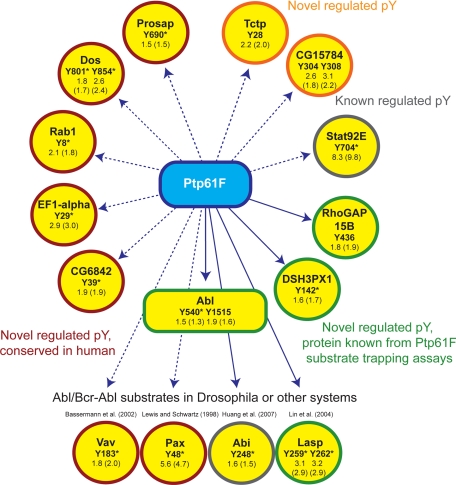
Signal transduction in metazoans regulates almost all aspects of biological function, and aberrant signaling is involved in many diseases. Perturbations in phosphorylation-based signaling networks are typically studied in a hypothesis-driven approach, using phospho-specific antibodies. Here we apply quantitative, high-resolution mass spectrometry to determine the systems response to the depletion of one signaling component. Drosophila cells were metabolically labeled using stable isotope labeling by amino acids in cell culture (SILAC) and the phosphatase Ptp61F, the ortholog of mammalian PTB1B, a drug target for diabetes, was knocked down by RNAi. In total we detected more than 10,000 phosphorylation sites in the phosphoproteome of Drosophila Schneider cells and trained a phosphorylation site predictor with this data. SILAC-based quantitation after phosphatase knock-down showed that apart from the phosphatase, the proteome was minimally affected whereas 288 of 6,478 high-confidence phosphorylation sites changed significantly. Responses at the phosphotyrosine level included the already described Ptp61F substrates Stat92E and Abi. Our analysis highlights a connection of Ptp61F to cytoskeletal regulation through GTPase regulating proteins and focal adhesion components.


Figures

Fig. 1.
Fig. 1.
Basal phosphoproteome of Drosophila SL2 cells. A, experimental procedure for quantitative phosphoproteomics with phosphatase inhibitor mixture treatment of the heavy labeled SL2 cell population. Phosphopeptides were enriched by applying two different strategies (supplemental Fig. 1) and analyzed by high-resolution mass spectrometry. B, experimental procedure for quantitative proteomics and phosphoproteomics in response to Ptp61F deletion by RNA interference. For proteome analysis extracted proteins were digested in gel after one-dimensional SDS-gelelectrophoresis. For phosphoproteome analysis extracted proteins were both in-gel and in-solution digested and enriched for phosphopeptides (supplemental Fig. 3).
Fig. 2.
Fig. 2.
Over- and under-represented cellular compartments in the basal phosphoproteome resulting from Gene Ontology analysis.
Fig. 3.
Fig. 3.
Precision-Recall curves reflecting the accuracy of phosphoserine and phosphothreonine prediction using the fly-specific predictor. The recall reflects the proportion of true positives to the sum of true positives and false negatives, whereas the precision describes the number of true positives out of all predicted positives.
Fig. 4.
Fig. 4.
RNAi of the tyrosine phosphatase Ptp61F and the effect on the proteome. A, histogram of log2-transformed normalized protein ratios for all quantified proteins in the Ptp61F RNAi experiment. B, plot of the normalized ratios of all quantified proteins plotted against their summed heavy and light peptide intensities. C, MS- based analysis of RNAi depletion: a peptide-pair for Ptp61F from the SILAC-based Ptp61F RNAi proteome experiment, where the phosphatase was depleted in the heavy samples. The Ptp61F peptide (GSVDYINANLVQLER) shows a heavy to light ratio (H/L) of 0.073 corresponding to a more than 10-fold reduction of the protein level. D, quantitative RT-PCR of Ptp61F transcript derived from mock control and Ptp61F RNAi cells. Ptp61F mRNA level is reduced to less than 20% by RNA interference. Error bars represent the standard deviation of three different technical replicates. GAPDH transcript levels were used for normalization.
Fig. 5.
Fig. 5.
Quantitative phosphoproteome upon Ptp61F RNAi. A, plot of normalized ratios of all quantified phosphorylation sites against their summed heavy and light peptide intensities (n = 6537). B, SILAC peptide pair of STAT92E, the most up-regulated phosphotyrosine peptide upon Ptp61F RNAi. C, SILAC peptide- pair of Abl, 1.9-fold up-regulation on a C-terminal autophosphoylation site.
Fig. 6.
Fig. 6.
Direct and indirect targets of Ptp61F. The H/L phosphopeptide ratios upon Ptp61F RNAi and in brackets their corresponding values normalized to the protein expression are indicated. Here only phosphotyrosines with normalization and a ratio belonging to a singly phosphorylated peptide are shown. Tyrosines with asterisk are conserved in human (supplemental Fig. 9).

References

    1. Aebersold R., Mann M. ( 2003) Mass spectrometry-based proteomics. Nature 422, 198– 207 - PubMed
    1. Schmelzle K., White F. M. ( 2006) Phosphoproteomic approaches to elucidate cellular signaling networks. Curr. Opin. Biotechnol. 17, 406– 414 - PubMed
    1. Witze E. S., Old W. M., Resing K. A., Ahn N. G. ( 2007) Mapping protein post-translational modifications with mass spectrometry. Nat. Methods 4, 798– 806 - PubMed
    1. Ong S. E., Mann M. ( 2005) Mass spectrometry-based proteomics turns quantitative. Nat. Chem. Biol. 1, 252– 262 - PubMed
    1. Ficarro S. B., McCleland M. L., Stukenberg P. T., Burke D. J., Ross M. M., Shabanowitz J., Hunt D. F., White F. M. ( 2002) Phosphoproteome analysis by mass spectrometry and its application to Saccharomyces cerevisiae. Nat. Biotechnol. 20, 301– 305 - PubMed

MeSH terms

Substances