. 2009 Jun;10(6):610-7.
doi: 10.1038/ni.1739.

Intraclonal competition limits the fate determination of regulatory T cells in the thymus

Affiliations

Intraclonal competition limits the fate determination of regulatory T cells in the thymus

Jhoanne L Bautista et al. Nat Immunol. 2009 Jun.

Abstract

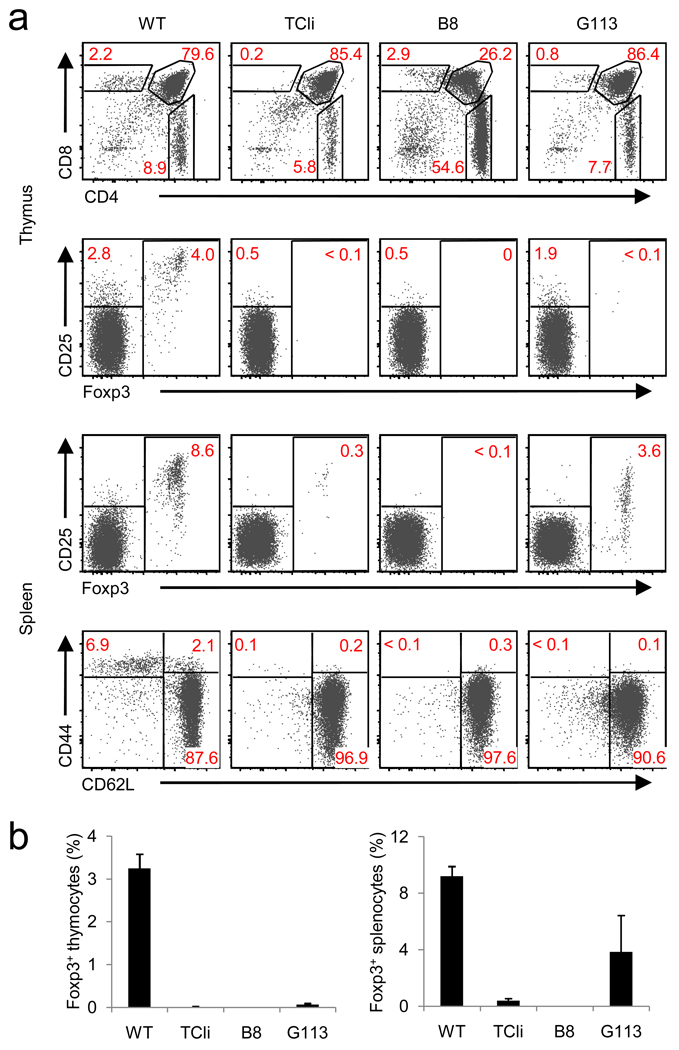
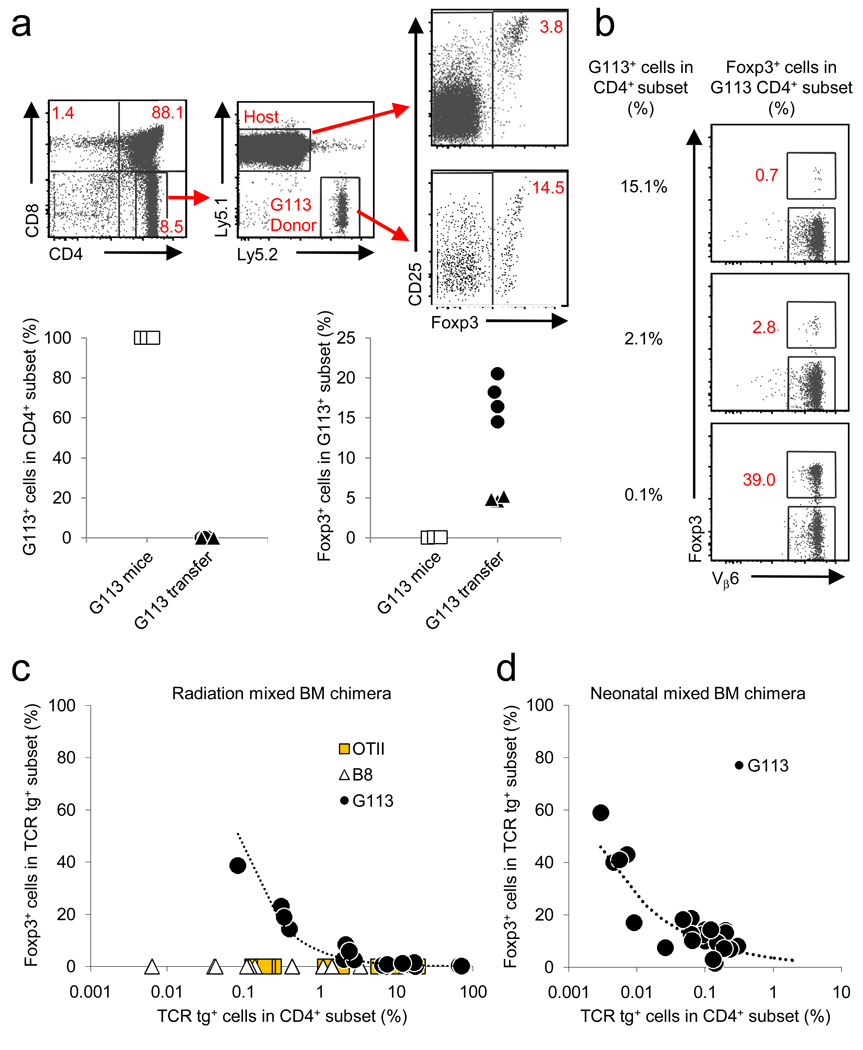
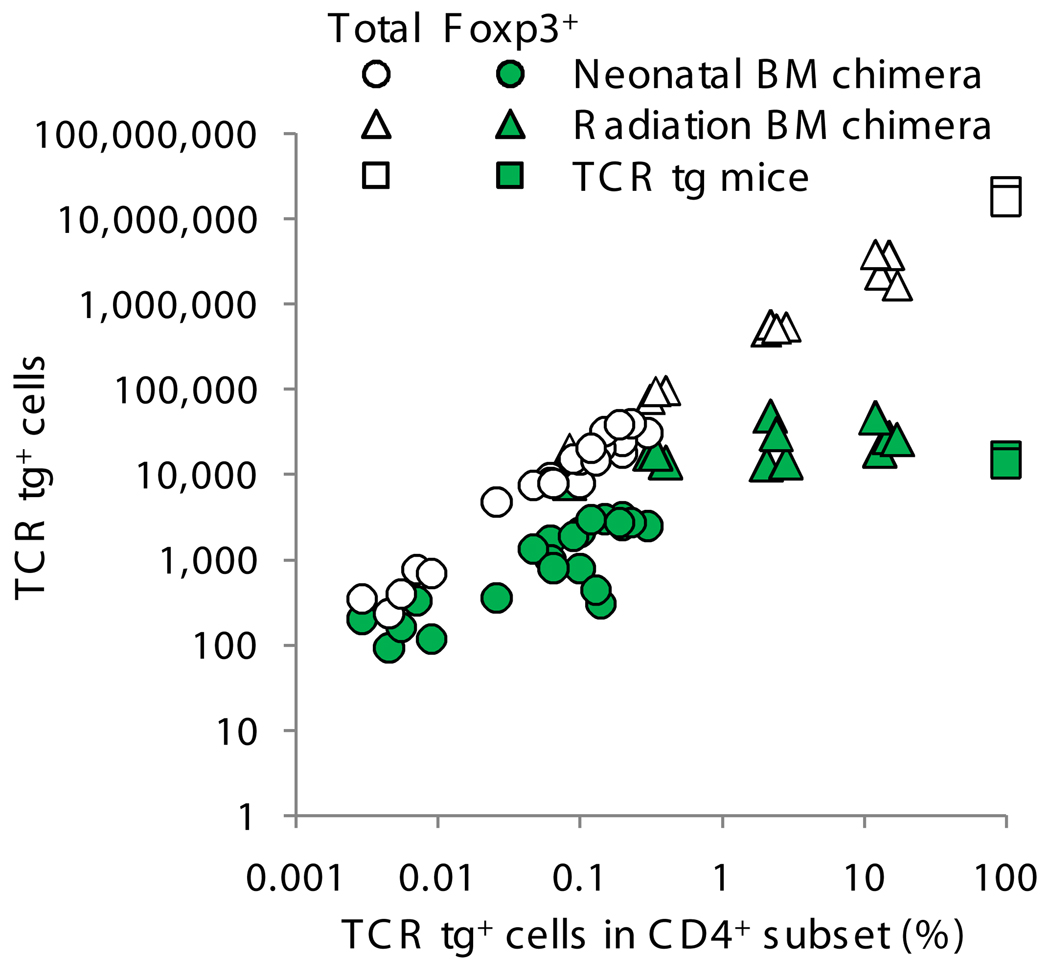
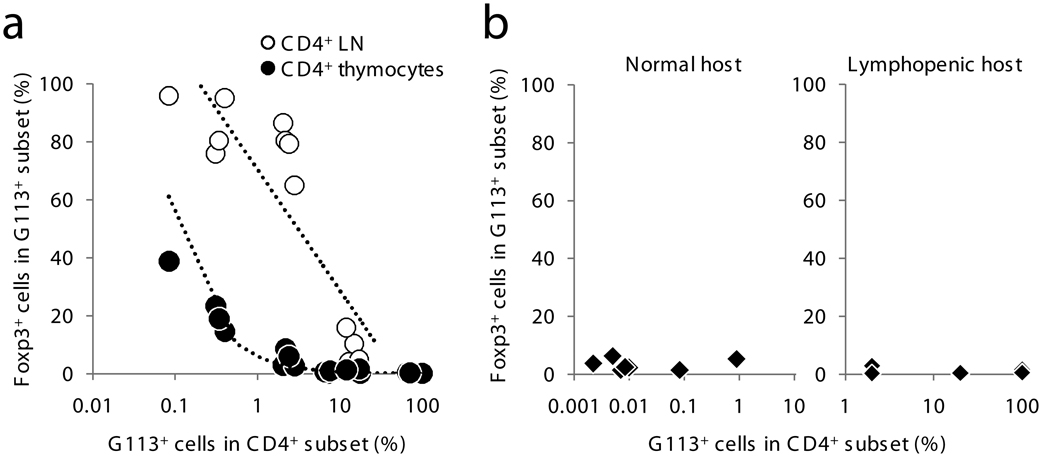
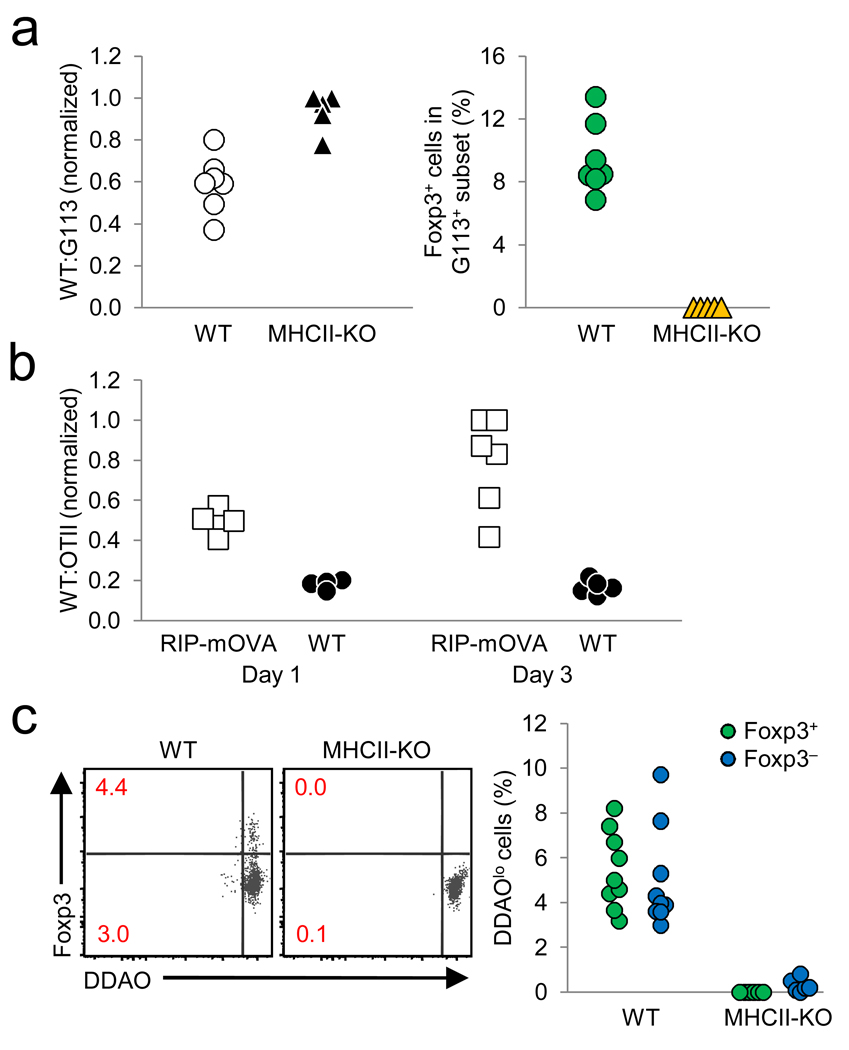
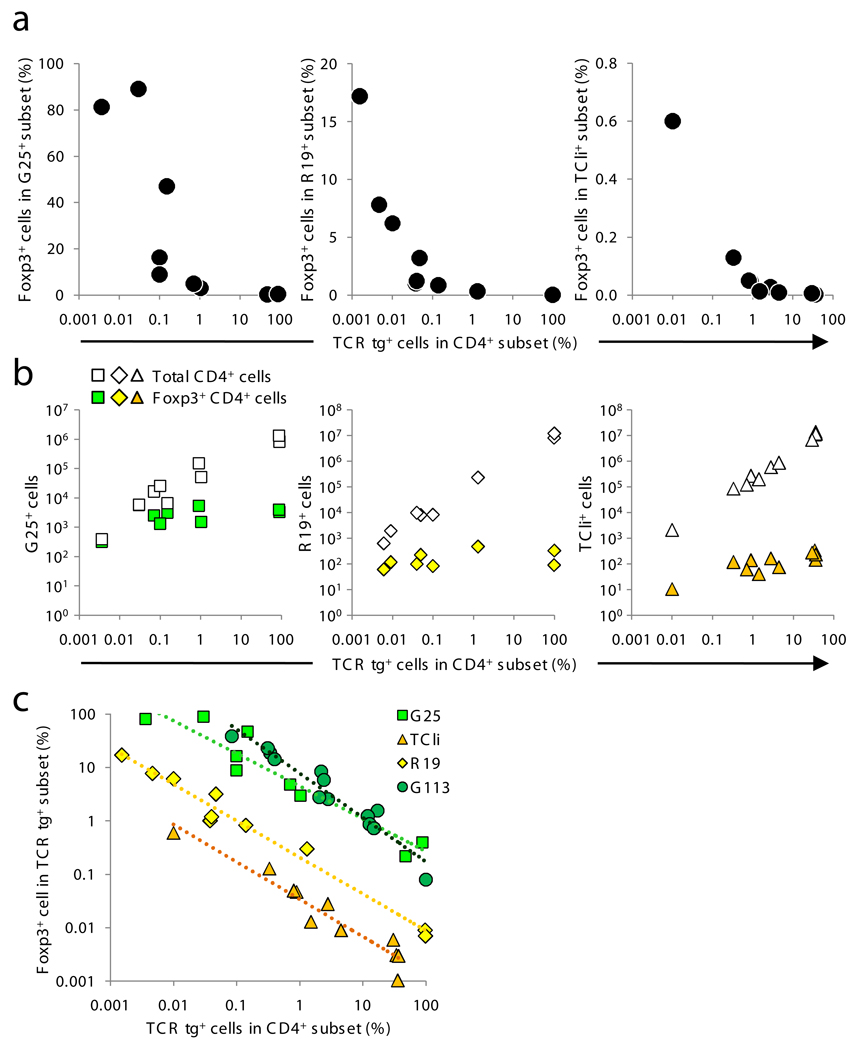
Because the deletion of self-reactive T cells is incomplete, thymic development of natural Foxp3+CD4+ regulatory T cells (Treg cells) is required for preventing autoimmunity. However, the function of T cell antigen receptor (TCR) specificity in thymic Treg cell development remains controversial. To address this issue, we generated a transgenic line expressing a naturally occurring Treg cell-derived TCR. Unexpectedly, we found that efficient thymic Treg cell development occurred only when the antigen-specific Treg cell precursors were present at low clonal frequency (o1%) in a normal thymus. Using retroviral vectors and bone marrow chimeras, we observed similar activity with two other Treg cell-derived TCRs. Our data demonstrate that thymic Treg cell development is a 'TCR-instructive' process involving a niche that can be saturable at much lower clonal frequencies than is the niche for positive selection.


Conflict of interest statement

The authors have no conflicts of interest to report.

Figures

Figure 1
Figure 1
Flow cytometric characterization of TCR transgenic lines. (a) FACS plots of thymic and splenic T cells from 6-week old TCR transgenic Foxp3 gfp Rag1 −/− mice expressing TCRs described in Table 1 (B8 and G113). Wild-type Foxp3 gfp (WT), and TCli αβ–TCR transgenic -Foxp3 gfp Rag1 −/− mice (origin of the TCRβ chain for B8 and G113) are shown as controls. (b) Summary of flow cytometric data. The frequency of Foxp3+ T cells in the CD4SP thymic (left) or CD4+ splenic (right) subset are shown (mean ± s.d., n=3). Data were obtained from 3 independent experiments.
Figure 2
Figure 2
An inverse relationship between TCR transgenic cell frequency and thymic Treg cell development. (a) G113 thymocytes (107) were intrathymically injected into congenic CD45.1 hosts, and analyzed by flow cytometry on day 3. The analysis scheme is illustrated in the FACS plots. The charts below show the percentage of CD45.2+ G113 cells in the CD4SP subset (left), and the percentage of Foxp3+ cells within the G113 population (right). Data from G113 transgenic Rag1 −/− mice (G113 mice) are shown for reference. The exact P-value from the Wilcoxon rank sum test between the percentage of Foxp3+ cells in the two settings is 0.017. Each symbol represents data from individual recipients from 2 independent experiments. (b–d) G113 BM was mixed with congenically marked wild-type BM at various ratios and injected into irradiated adult wild-type recipients or non-irradiated neonatal CD45.1 Foxp3 gfp recipients as described in the Methods. (b) Representative dot plots are gated on G113 CD45.2+CD45.1CD4SP thymocytes from the radiation BM chimeras. The G113 TCR incorporates a Vβ6 chain. (c,d) Graphs show the frequency of G113 cells in the CD4SP subset versus the frequency of Foxp3+ cells. Each symbol represents an individual recipient. For radiation BM chimeras, 4 independent experiments were performed. For neonatal BM chimeras, 3 independent experiments were performed. Using a linear mixed model, we detected a significant difference between OTII or B8 and G113 (P < 0.01), but not between B8 and OTII (P = 0.41).
Figure 3
Figure 3
Foxp3+ G113 Treg cell generation is saturable. Graph shows the absolute number of Foxp3+CD4SP cells from TCR transgenic mice and from irradiation and neonatal BM chimeras (Fig. 2c–d). Numbers were derived from the total number of thymocytes multiplied by the frequency of Foxp3+ G113 CD4SP T cells. Also shown is the total number of TCR transgenic CD4SP thymocytes in each mouse. Each symbol represents data from an individual mouse from 7 independent experiments.
Figure 4
Figure 4
Peripheral versus thymic G113 Treg cell development. (a) Graph shows the frequency of G113 TCR transgenic T cells which are Foxp3+ in the thymus and in the pooled axillary and inguinal lymph nodes (LN). The data are indexed to the percent of TCR transgenic cells in the CD4SP subset in radiation mixed BM chimeras (Fig. 2b–c). The Wilcoxon signed rank test for paired samples gives a P-value of < 0.01 between the thymus and LN. Data were obtained from 2 independent experiments. (b) FACS-purified peripheral Foxp3 G113 T cells were intravenously transferred into congenic wild-type or lymphopenic Tcrb −/− hosts as described in the Methods. The frequency of Foxp3+ cells was analyzed after 3 weeks by flow cytometry. Of note, T cells using the naÏve TCR B8 did not undergo conversion when transferred into lymphopenic hosts (data not shown). Each symbol represents data from an individual mouse from 3 independent experiments.
Figure 5
Figure 5
No evidence for proliferation or negative selection during TCR-dependent G113 Treg cell development. (a) Wild-type and G113 Rag1 −/− thymocytes (1:1 ratio) were intrathymically injected into wild-type (WT) or MHC class II-deficient hosts. After three days, the ratio of remaining WT:G113 CD4SP cells (left), and the frequency of Foxp3+ G113 CD4SP cells (right) were determined by flow cytometry. The donor G113 cells were discriminated by DDAO labeling, CD45.2, and Thy1.2 expression; the co-injected wild-type cells by DDAO labeling, CD45.2, and Thy1.1 expression; and the host cells by CD45.1 expression. Each symbol represents an individual recipient. Data from 2 independent experiments are shown (3–4 WT and 2–3 MHC class II-deficient hosts per experiment), and were normalized by dividing the WT:TCR tg ratio with the highest value for a given experiment. (b) Whole thymocytes from OTII Rag1 −/− mice and Thy1.1 wild-type mice were mixed at a 1:1 ratio and intrathymically injected into congenically marked wild-type or RIP-mOVA mice and analyzed 1 and 3 days post-injection by flow cytometry. Data are from 2 independent experiments (5 WT and 5–6 RIP-mOVA recipients per experiment). (c) Sorted Thy1.1 wild-type and G113 Rag1 −/− HSAhi CD25lo Foxp3 CD4SP cells (5×10⁵ total at 1:1 ratio) were DDAO labeled and intrathymically injected into wild-type or MHC class II-deficient recipients, and analyzed by flow cytometry on day 3. Numbers in dot plots indicate the frequency of DDAOlo cells for the Foxp3+ and Foxp3 CD4SP cells; these frequencies are summarized in the graph on the right. Data are from 2 independent experiments using 9 WT and 6 MHC class II-deficient hosts.
Figure 6
Figure 6
Varying efficiencies of TCR-dependent Treg cell development. (a–b) G25 and R19 (Table 1) were retrovirally expressed in Foxp3 gfp Rag1 −/− BM and mixed with CD45.1 Foxp3 gfp BM at varying ratios. In the case of TCli, TCli-αβ TCR transgenic Foxp3 gfp Rag1 −/− BM was used. (a) Thymocytes were analyzed by flow cytometry as in Fig. 2b–c. (b) The absolute numbers of Treg and CD4SP thymocytes were plotted as in Fig. 3. Each symbol represents data from an individual mouse from 2 independent experiments (n=10–12). (c) Data are plotted as in Fig. 2c, except the frequency of Foxp3+ cells is on a log scale. Using a linear mixed model taking the percentage of CD4SP cells into consideration, we detected significant differences in pair wise comparisons between G113, R19, and TCli (P < 0.01), but not G113 and G25 (P = 0.08). The geometric means of percent Foxp3+ cells (±s.e.m.) for each TCR are: G113 (6.5 ± 1.0), G25 (4.3 ± 0.8), R19 (0.2 ± 0.04), and TCli (0.03 ± 0.006).

Comment in

  • Treg cells meet their limit.
    Hogquist KA, Moran AE. Hogquist KA, et al. Nat Immunol. 2009 Jun;10(6):565-6. doi: 10.1038/ni0609-565. Nat Immunol. 2009. PMID: 19448655 No abstract available.

References

    1. Sakaguchi S, Yamaguchi T, Nomura T, Ono M. Regulatory T cells and immune tolerance. Cell. 2008;133:775–787. - PubMed
    1. Lahl K, et al. Selective depletion of Foxp3+ regulatory T cells induces a scurfy-like disease. J. Exp. Med. 2007;204:57–63. - PMC - PubMed
    1. Kim JM, Rasmussen JP, Rudensky AY. Regulatory T cells prevent catastrophic autoimmunity throughout the lifespan of mice. Nat. Immunol. 2007;8:191–197. - PubMed
    1. Apostolou I, von Boehmer H. In vivo instruction of suppressor commitment in naive T cells. J. Exp. Med. 2004;199:1401–1408. - PMC - PubMed
    1. Curotto de Lafaille MA, et al. Adaptive Foxp3+ regulatory T cell-dependent and -independent control of allergic inflammation. Immunity. 2008;29:114–126. - PubMed

Publication types

Substances