

Genome-wide association study of blood pressure and hypertension
- PMID: 19430479
- PMCID: PMC2998712
- DOI: 10.1038/ng.384
Genome-wide association study of blood pressure and hypertension
Abstract
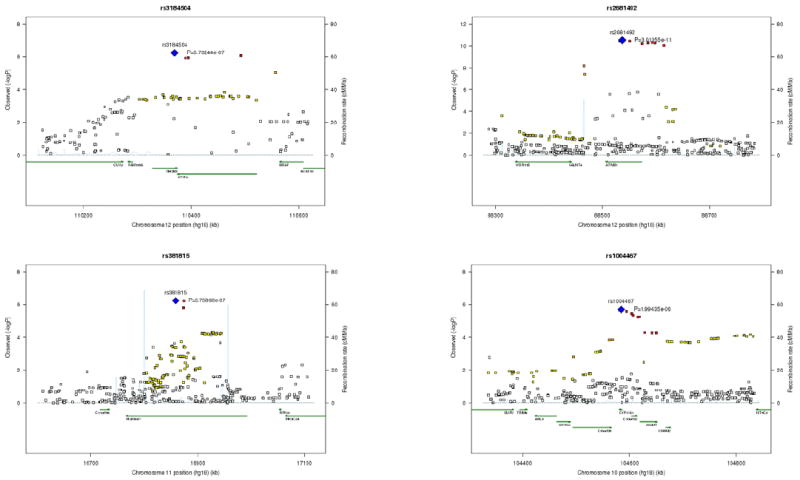
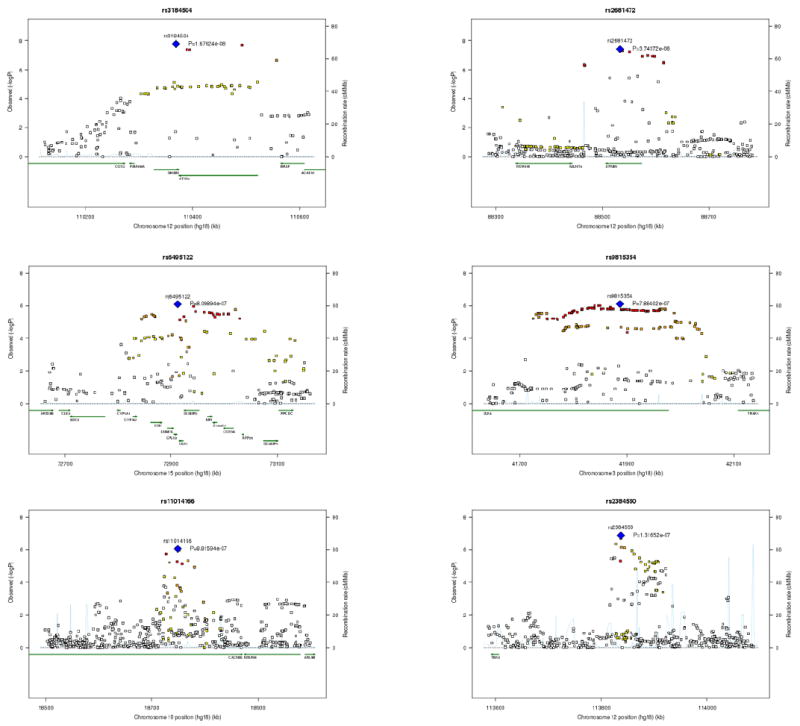
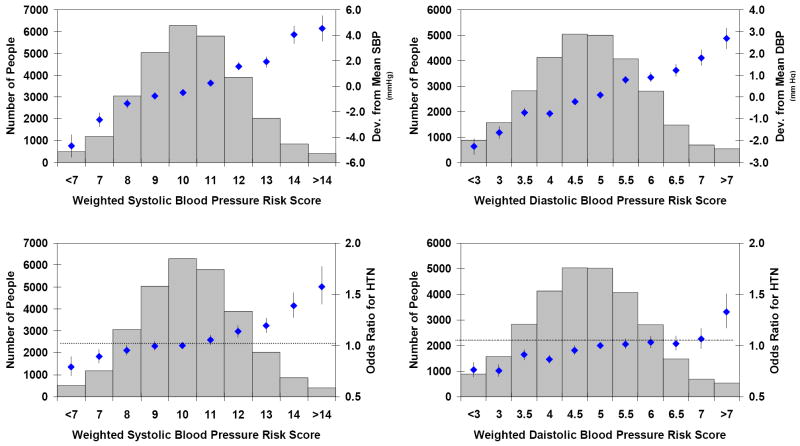
Blood pressure is a major cardiovascular disease risk factor. To date, few variants associated with interindividual blood pressure variation have been identified and replicated. Here we report results of a genome-wide association study of systolic (SBP) and diastolic (DBP) blood pressure and hypertension in the CHARGE Consortium (n = 29,136), identifying 13 SNPs for SBP, 20 for DBP and 10 for hypertension at P < 4 × 10(-7). The top ten loci for SBP and DBP were incorporated into a risk score; mean BP and prevalence of hypertension increased in relation to the number of risk alleles carried. When ten CHARGE SNPs for each trait were included in a joint meta-analysis with the Global BPgen Consortium (n = 34,433), four CHARGE loci attained genome-wide significance (P < 5 × 10(-8)) for SBP (ATP2B1, CYP17A1, PLEKHA7, SH2B3), six for DBP (ATP2B1, CACNB2, CSK-ULK3, SH2B3, TBX3-TBX5, ULK4) and one for hypertension (ATP2B1). Identifying genes associated with blood pressure advances our understanding of blood pressure regulation and highlights potential drug targets for the prevention or treatment of hypertension.
Figures
References
-
- Fields LE, Burt VL, Cutler JA, Hughes J, Roccella EJ, Sorlie P. The burden of adult hypertension in the United States, 1999–2000: a rising tide. Hypertension. 2004;44:398–404. - PubMed
-
- Lawes CM, Vander Hoorn S, Rodgers A. International Society of Hypertension. Global burden of blood-pressure-related disease, 2001. Lancet. 2008;371(9623):1513–8. - PubMed
-
- VA Cooperative Study Group. Effects of treatment on morbidity in hypertension. Results in patients with diastolic blood pressures averaging 115 through 129 mm Hg. JAMA. 1967;202(11):1028–34. - PubMed
-
- SHEP Cooperative Research Group. Prevention of stroke by antihypertensive drug treatment in older persons with isolated systolic hypertension. Final results of the Systolic Hypertension in the Elderly Program (SHEP) JAMA. 1991;265(24):3255–64. - PubMed
-
- Levy D, DeStefano AL, Larson MG, O’Donnell CJ, Lifton RP, Gavras H, Cupples LA, Myers RH. Evidence for a Blood Pressure Gene on Chromosome 17: Genome Scan Results for longitudinal blood pressure phenotypes in subjects from the Framingham Heart Study. Hypertension. 2000;36:477–483. - PubMed
Publication types
MeSH terms
Grants and funding
- R01 HL086694/HL/NHLBI NIH HHS/United States
- N01-HC-85086/HC/NHLBI NIH HHS/United States
- U01HG004402/HG/NHGRI NIH HHS/United States
- R37HL051021/HL/NHLBI NIH HHS/United States
- U10HL054512/HL/NHLBI NIH HHS/United States
- N01 HC045133/HC/NHLBI NIH HHS/United States
- UL1RR025005/RR/NCRR NIH HHS/United States
- N02-HL-6-4278/HL/NHLBI NIH HHS/United States
- N01-HC-25195/HC/NHLBI NIH HHS/United States
- N01 HC055022/HC/NHLBI NIH HHS/United States
- N01 HC085086/HC/NHLBI NIH HHS/United States
- N01 HC055016/HL/NHLBI NIH HHS/United States
- N01 AG012100/AG/NIA NIH HHS/United States
- N01 HC055019/HL/NHLBI NIH HHS/United States
- N01-HC-85085/HC/NHLBI NIH HHS/United States
- R01HL59367/HL/NHLBI NIH HHS/United States
- UL1 RR025005/RR/NCRR NIH HHS/United States
- U01 HL080295/HL/NHLBI NIH HHS/United States
- N02 HL064278/HL/NHLBI NIH HHS/United States
- N01 HC075150/HC/NHLBI NIH HHS/United States
- N01-HC-55022/HC/NHLBI NIH HHS/United States
- N01-HC-85081/HC/NHLBI NIH HHS/United States
- R01 HL059367/HL/NHLBI NIH HHS/United States
- N01 HC055021/HL/NHLBI NIH HHS/United States
- N01 HC015103/HC/NHLBI NIH HHS/United States
- N01 HC085086/HL/NHLBI NIH HHS/United States
- N01-HC-55016/HC/NHLBI NIH HHS/United States
- N01 HC055018/HC/NHLBI NIH HHS/United States
- N01 HC025195/HC/NHLBI NIH HHS/United States
- N01 HC055015/HL/NHLBI NIH HHS/United States
- R01 HL087652/HL/NHLBI NIH HHS/United States
- N01-HC-55021/HC/NHLBI NIH HHS/United States
- HHSN268200625226C/PHS HHS/United States
- U01 HG004402/HG/NHGRI NIH HHS/United States
- N01 HC055020/HL/NHLBI NIH HHS/United States
- N01-HC-85082/HC/NHLBI NIH HHS/United States
- N01 HC055019/HC/NHLBI NIH HHS/United States
- P30 DK063491/DK/NIDDK NIH HHS/United States
- N01 HC-55222/HC/NHLBI NIH HHS/United States
- N01-HC-55019/HC/NHLBI NIH HHS/United States
- N01 HC025195/HL/NHLBI NIH HHS/United States
- R01HL087641/HL/NHLBI NIH HHS/United States
- N01-HC-55015/HC/NHLBI NIH HHS/United States
- N01 HC055222/HL/NHLBI NIH HHS/United States
- N01 HC055222/HC/NHLBI NIH HHS/United States
- N01 HC085079/HL/NHLBI NIH HHS/United States
- N01-HC-85083/HC/NHLBI NIH HHS/United States
- N01-HC-75150/HC/NHLBI NIH HHS/United States
- N01-HC-55020/HC/NHLBI NIH HHS/United States
- N01-HC-85080/HC/NHLBI NIH HHS/United States
- N01 HC055015/HC/NHLBI NIH HHS/United States
- ImNIH/Intramural NIH HHS/United States
- N01 HC055021/HC/NHLBI NIH HHS/United States
- N01 HC055018/HL/NHLBI NIH HHS/United States
- N01-HC-85079/HC/NHLBI NIH HHS/United States
- N01 HC055022/HL/NHLBI NIH HHS/United States
- N01 HC055020/HC/NHLBI NIH HHS/United States
- N01 HC085079/HC/NHLBI NIH HHS/United States
- N01 HC075150/HL/NHLBI NIH HHS/United States
- N01-HC-55018/HC/NHLBI NIH HHS/United States
- R01 HL087641/HL/NHLBI NIH HHS/United States
- N01 HC035129/HC/NHLBI NIH HHS/United States
- R37 HL051021/HL/NHLBI NIH HHS/United States
- N01 HC055016/HC/NHLBI NIH HHS/United States
- N01-HC-85084/HC/NHLBI NIH HHS/United States
- U10 HL054512/HL/NHLBI NIH HHS/United States
- R01HL086694/HL/NHLBI NIH HHS/United States
LinkOut - more resources
Full Text Sources
Other Literature Sources
Medical
Molecular Biology Databases
Research Materials
