

Prediction of modified release pharmacokinetics and pharmacodynamics from in vitro, immediate release, and intravenous data
- PMID: 19430911
- PMCID: PMC2691467
- DOI: 10.1208/s12248-009-9107-2
Prediction of modified release pharmacokinetics and pharmacodynamics from in vitro, immediate release, and intravenous data
Abstract
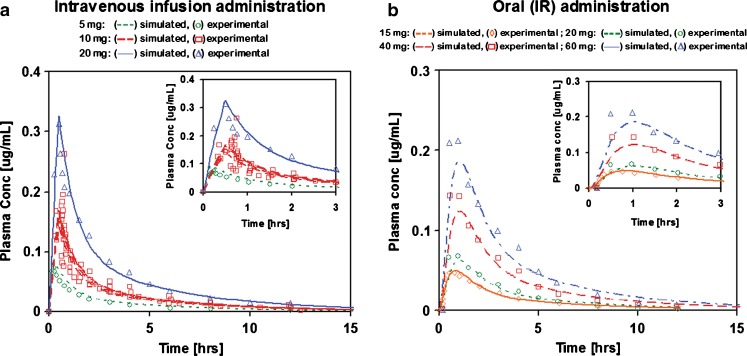
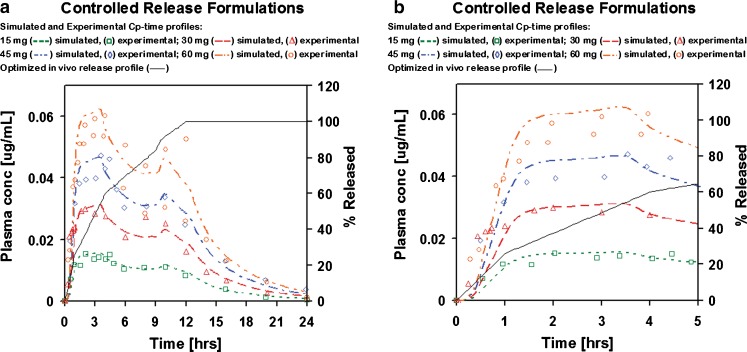
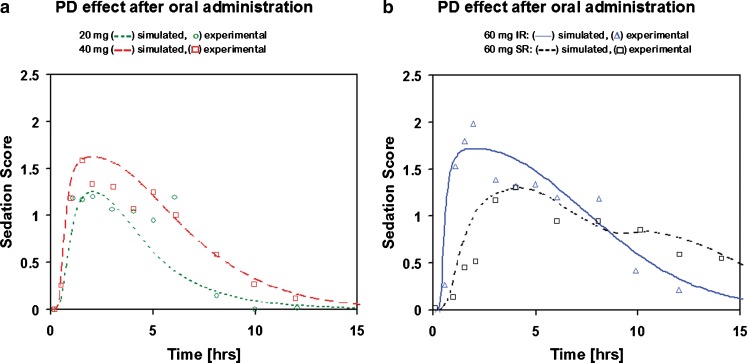
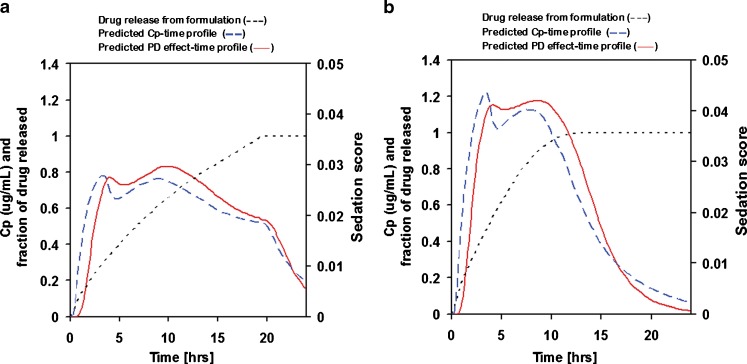
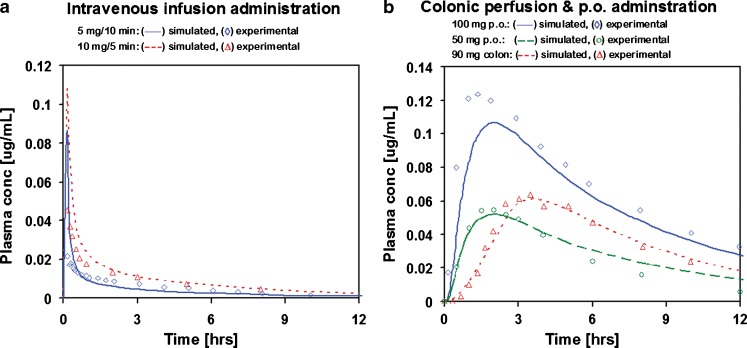
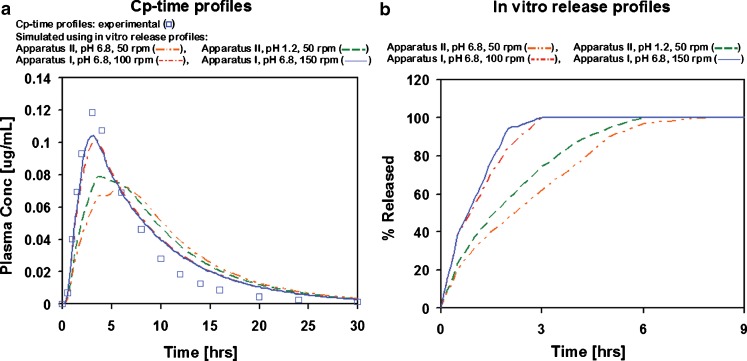
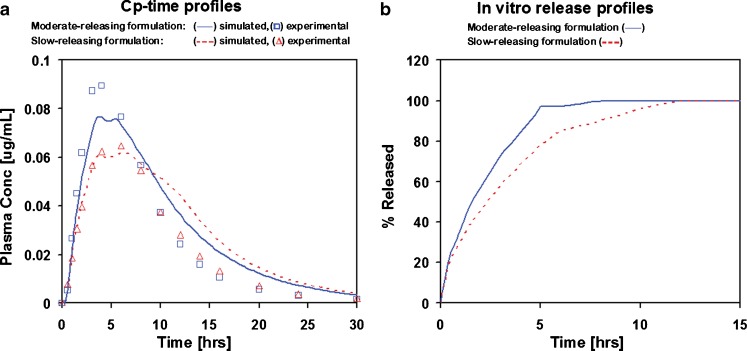
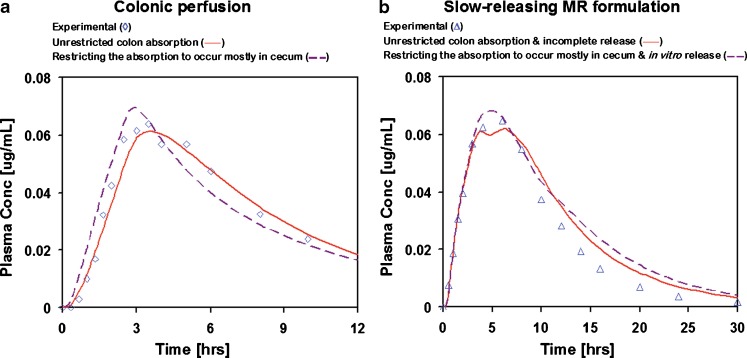
The aim of this study was to demonstrate the value of mechanistic simulations in gaining insight into the behaviors of modified release (MR) formulations in vivo and to use the properly calibrated models for prediction of pharmacokinetics (PK) and pharmacodynamics (PD). GastroPlus (Simulations Plus, Inc.) was used to fit mechanistic models for adinazolam and metoprolol that describe the absorption, PK, and PD after intravenous (i.v.) and immediate release (IR) oral (p.o.) administration. The fitted model for adinazolam was then used to predict the PD profile for a MR formulation and to design a new formulation with desired onset and duration of action. The fitted metoprolol model was used to gain insight and to explain the in vivo behaviors of MR formulations. For each drug, a single absorption/PK model was fitted that provided simulated plasma concentration-time profiles closely matching observed in vivo profiles across several different i.v. and p.o doses. Sedation score profiles of adinazolam were fitted with an indirect PD model. For metoprolol, the fitted absorption/PK model for IR p.o. doses was used to select in vitro dissolution conditions that best matched the in vivo release of MR doses. This model also explained differences in exposure after administration of MR formulations with different release rates. Mechanistic absorption/PK models allow for detailed descriptions of all processes affecting the two drugs' bioavailability, including release/dissolution, absorption, and intestinal and hepatic first pass extraction. The insights gained can be used to design formulations that more effectively overcome identified problems.
Figures
Similar articles
-
In silico predictions of gastrointestinal drug absorption in pharmaceutical product development: application of the mechanistic absorption model GI-Sim.Eur J Pharm Sci. 2013 Jul 16;49(4):679-98. doi: 10.1016/j.ejps.2013.05.019. Epub 2013 May 29. Eur J Pharm Sci. 2013. PMID: 23727464
-
Pharmacokinetic analysis of modified-release metoprolol formulations: An interspecies comparison.Eur J Pharm Sci. 2017 Jan 15;97:135-142. doi: 10.1016/j.ejps.2016.10.039. Epub 2016 Nov 2. Eur J Pharm Sci. 2017. PMID: 27816630
-
Evaluation of in vitro release rate and in vivo absorption characteristics of four metoprolol tartrate immediate-release tablet formulations.Pharm Dev Technol. 1997 Feb;2(1):11-24. doi: 10.3109/10837459709022605. Pharm Dev Technol. 1997. PMID: 9552427 Clinical Trial.
-
Early pharmaceutical profiling to predict oral drug absorption: current status and unmet needs.Eur J Pharm Sci. 2014 Jun 16;57:173-99. doi: 10.1016/j.ejps.2013.10.015. Epub 2013 Nov 9. Eur J Pharm Sci. 2014. PMID: 24215735 Review.
-
In vitro models for the prediction of in vivo performance of oral dosage forms.Eur J Pharm Sci. 2014 Jun 16;57:342-66. doi: 10.1016/j.ejps.2013.08.024. Epub 2013 Aug 27. Eur J Pharm Sci. 2014. PMID: 23988843 Review.
Cited by
-
Advancing internal exposure and physiologically-based toxicokinetic modeling for 21st-century risk assessments.J Expo Sci Environ Epidemiol. 2019 Jan;29(1):11-20. doi: 10.1038/s41370-018-0046-9. Epub 2018 Aug 16. J Expo Sci Environ Epidemiol. 2019. PMID: 30116055 Free PMC article. Review.
-
A case study of in silico modelling of ciprofloxacin hydrochloride/metallic compound interactions.AAPS PharmSciTech. 2014 Apr;15(2):270-8. doi: 10.1208/s12249-013-0055-x. Epub 2013 Dec 5. AAPS PharmSciTech. 2014. PMID: 24306676 Free PMC article.
-
Surge Dose® Formulations of NSAIDs Provide for Ultra-Rapid and Consistent Drug Absorption in Both the Fasted and Fed State as Predicted by Physiologically Based Biopharmaceutics Modelling.Pharmaceutics. 2025 May 28;17(6):708. doi: 10.3390/pharmaceutics17060708. Pharmaceutics. 2025. PMID: 40574021 Free PMC article.
-
Mechanistic Deconvolution of Oral Absorption Model with Dynamic Gastrointestinal Fluid to Predict Regional Rate and Extent of GI Drug Dissolution.AAPS J. 2019 Nov 11;22(1):3. doi: 10.1208/s12248-019-0385-z. AAPS J. 2019. PMID: 31712917 Free PMC article.
-
Biopharmaceutical Evaluation and CMC Aspects of Oral Modified Release Formulations.AAPS J. 2017 Sep;19(5):1348-1358. doi: 10.1208/s12248-017-0112-6. Epub 2017 Jul 5. AAPS J. 2017. PMID: 28681160
References
-
- Emami J. In vitro–in vivo correlation: from theory to applications. J Pharm Pharmaceut Sci. 2006;9:31–51. - PubMed
-
- FDA CDER . Guidance for industry: extended release oral dosage forms: development, evaluation, and application of in vitro/in vivo correlations. Silver Spring, MD: FDA CDER; 1997. - PubMed
MeSH terms
Substances
LinkOut - more resources
Full Text Sources
Other Literature Sources
Medical
