. 2009 Jun 15;199(12):1872-82.
doi: 10.1086/598858.

Responsiveness of T cells to interleukin-7 is associated with higher CD4+ T cell counts in HIV-1-positive individuals with highly active antiretroviral therapy-induced viral load suppression

Affiliations

Responsiveness of T cells to interleukin-7 is associated with higher CD4+ T cell counts in HIV-1-positive individuals with highly active antiretroviral therapy-induced viral load suppression

Jose F Camargo et al. J Infect Dis. .

Abstract

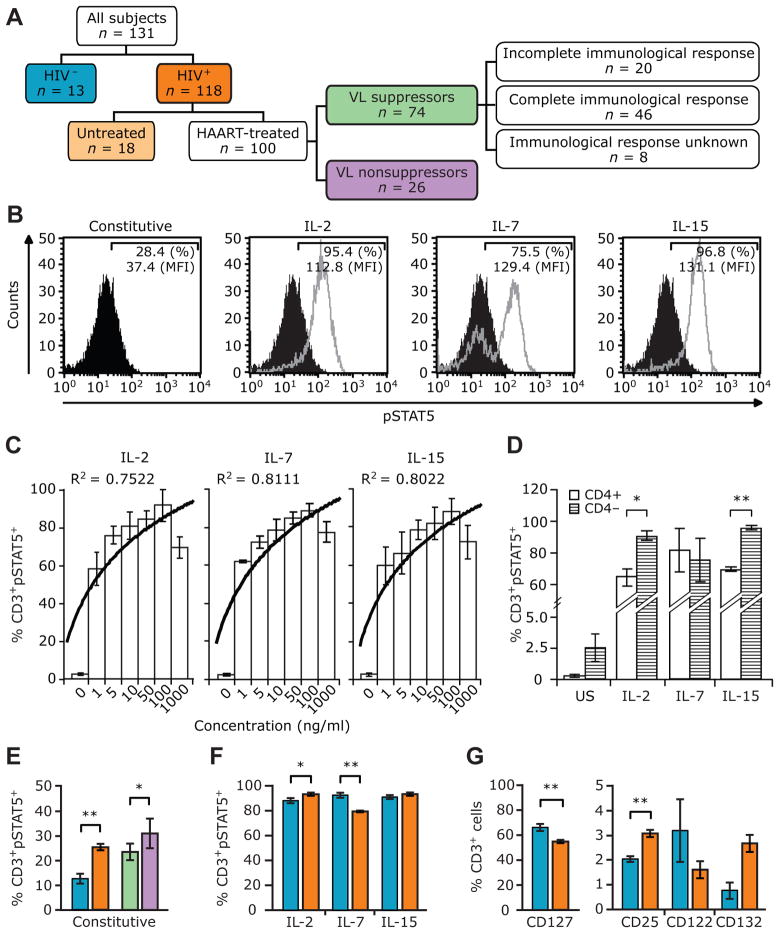
Background: Despite suppression of the human immunodeficiency virus type 1 (HIV-1) load by highly active antiretroviral therapy (HAART), recovery of CD4+ T cell counts can be impaired. We investigated whether this impairment may be associated with hyporesponsiveness of T cells to gamma-chain (gammac) cytokines known to influence T cell homeostasis.

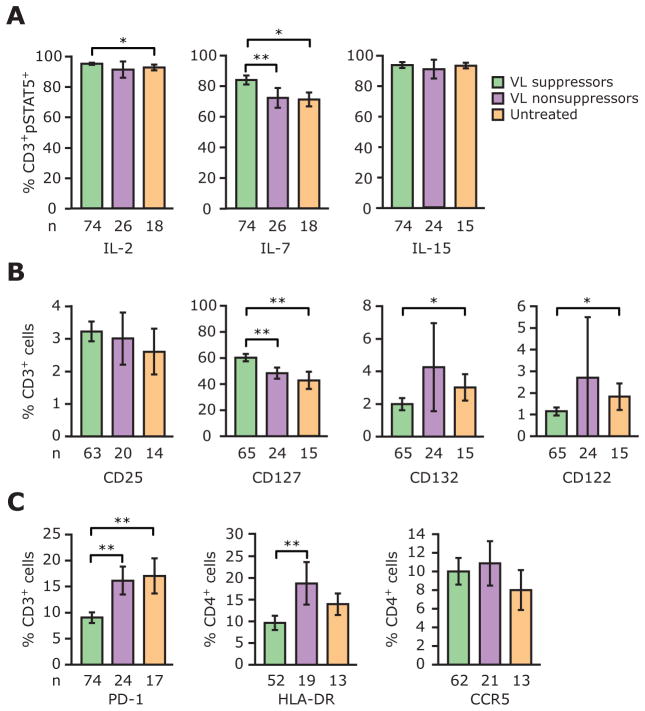
Methods: The responsiveness of T cells to interleukin (IL)-2, IL-7, and IL-15 was determined by assessing cytokine-induced phosphorylation of the signal transducer and activator of transcription 5 (STAT5) in peripheral T cells obtained from 118 HIV-positive subjects and 13 HIV-negative subjects.

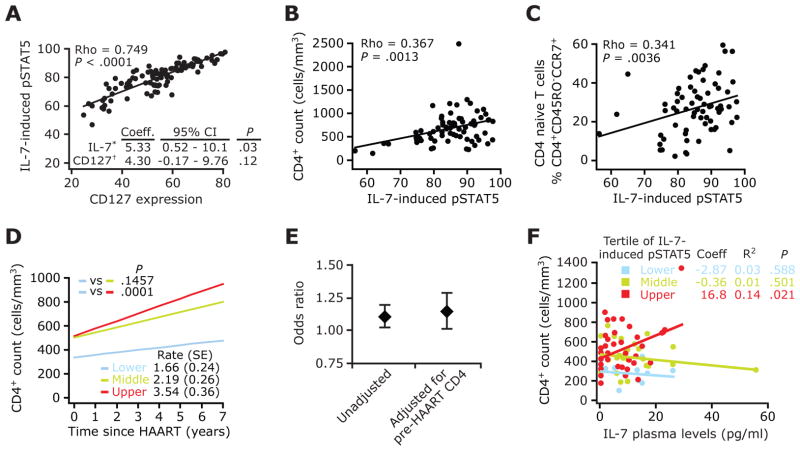
Results: The responsiveness of T cells to interleukin (IL)-7 but not to IL-2 or IL-15 was lower among HIV-positive subjects than among HIV-negative subjects. Among subjects with viral load suppression, the degree of IL-7 responsiveness (1) correlated with naive CD4+ T cell counts and was a better immune correlate of the prevailing CD4+ T cell count than were levels of human leukocyte antigen-DR1 or programmed death-1, which are predictors of T cell homeostasis during HIV infection; and (2) was greater in subjects with complete (i.e., attainment of >or=500 CD4+ T cells/mm3>or=5 years after initiation of HAART) versus incomplete immunologic responses. The correlation between plasma levels of IL-7 and CD4+ T cell counts during HAART was maximal in subjects with increased IL-7 responsiveness.

Conclusions: Responsiveness of T cells to IL-7 is associated with higher CD4+ T cell counts during HAART and thus may be a determinant of the extent of immune reconstitution.


Conflict of interest statement

Potential conflicts of interest: none.

Figures

Figure 1
Figure 1
Constitutive and γ-chain (γc) cytokine-induced phosphorylated signal transducer and activator of transcription 5 (pSTAT5) levels in HIV-positive and HIV-negative subjects. A, Study groups. Unless otherwise indicated, the color codes used in this panel are used in the remainder of the panels in this figure and in figure 2. B, Representative histograms of constitutive (black) and cytokine-induced (gray) pSTAT5 levels in an HIV-positive subject. Percentages denote the percentages of CD3+ T cells that were also positive for pSTAT5. Mean fluorescence intensity (MFI) values for pSTAT5 present in CD3+ T cells are also shown. Interleukin (IL)-2, IL-7, or IL-15 responsiveness is used interchangeably with IL-2-, IL-7-, or IL-15-induced pSTAT5 and responsiveness of T cells to the indicated cytokines. C, Percentages of CD3+ pSTAT5+ cells after stimulation with increasing concentrations of IL-2, IL-7, or IL-15. Histograms and error bars denote the mean levels and 95% confidence intervals, respectively, of constitutive (denoted by “0”) and cytokine-induced pSTAT5 in CD3+ T cells. The trend line denotes a logarithmic curve fit measured and shown as R2 values. Data are from 4 different HIV-negative subjects. D, Percentages of CD3+ pSTAT5+ cells in CD4+ and CD4 (i.e., CD8+) T cells after stimulation with 100 ng of the indicated cytokines per milliliter. US, unstimulated. Data are from 3 different HIV-negative individuals, and similar results were obtained when gating on CD8+ and CD8 T cells (data not shown). E–G, Histograms and error bars denote the mean levels and 95% confidence intervals, respectively, of constitutive (E) and cytokine-induced pSTAT5 (F) and cytokine receptors (G) in the indicated study groups. P values were calculated using Student’s t test. *P<.05; **P<.01. P = .06, for the difference in CD132 expression between HIV-positive and HIV-negative subjects. Data in panels E and F are for 118 HIV-positive and 13 HIV-negative subjects, except in panel F, in which the data for IL-15 are derived for 110 HIV-positive subjects. Data in panel G are for 104 HIV-positive and 13 HIV-negative subjects, with the exception of data for CD25, which are for 97 HIV-positive subjects.
Figure 2
Figure 2
Levels of phosphorylated signal transducer and activator of transcription 5 (pSTAT5) and cytokine receptors differ among subjects with viral load (VL) suppression, those without VL suppression, and untreated HIV-positive subjects. Histograms and error bars denote the mean percentage and 95% confidence interval, respectively, of CD3+ or CD4+ cells that express the indicated parameters, which are γ-chain (γc) cytokine-induced pSTAT5 (%CD3+ pSTAT5+ T cells) (A), cytokine receptors (B), and programmed death-1 (PD-1), HLA-DR, and CCR5 (C). P values were derived using Student’s t test.*P<.05;**P<.01. n, no. of subjects from whom the data were derived.
Figure 3
Figure 3
Responsiveness of T cells to interleukin (IL)-7 is associated with prevailing CD4+ T cell counts during HAART and modulates the influence of plasma IL-7 on immune recovery. A, Scatterplots depicting pairwise correlations between IL-7 responsiveness and CD127 expression in all HIV-positive subjects. Inset, A multivariate linear regression model in which the CD4+ T cell count was the outcome variable and levels of IL-7-induced phosphorylated signal transducer and activator of transcription 5 (pSTAT5) (IL-7*) and CD127 (CD127†) were the predictors. Coeff., regression coefficient; CI, confidence interval. Data are derived from 102 HIV-positive subjects. B and C, Scatterplots show the correlation between IL-7-induced pSTAT5 levels and total (B) and naive (C) CD4+ T cell counts in subjects with viral load (VL) suppression. A–C, Numbers in the upper left denote Spearman’s ρ coefficient and significance. Data in panels B and C are for 74 and 69 subjects with VL suppression, respectively. D, CD4+ T cell trajectories from the time of initiation of HAART in subjects with VL suppression, according to the upper, middle, and lower tertiles of IL-7-induced pSTAT5 levels. The overall monthly rate of CD4+ T cell gains (± standard error [SE]), as estimated by linear generalized estimating equations, is shown at the bottom right. P values denote differences in rates of increases in CD4+ T cell counts between tertiles of IL-7-induced pSTAT5, with the lower tertile (blue) used as the reference group. The number of subjects and the number of CD4+ T cell count measurements (shown in parentheses) in the lower, middle, and upper tertiles of IL-7-induced pSTAT5 levels were 13 (186), 27 (418), and 34 (541), respectively. E, Results of nested logistic regression analyses in which the likelihood of a complete immunologic response associated with responsiveness of T cells to IL-7 (IL-7-induced pSTAT5 levels were used as a continuous variable) was computed before and after adjustment for the pre-HAART CD4+ T cell count. Diamonds and error bars denote the odds ratio and 95% CI, respectively, of having a complete immunologic response. Data are derived from 66 subjects with VL suppression. F, Association between plasma IL-7 levels and prevailing CD4+ T cell counts within each tertile of IL-7-induced pSTAT5. IL-7-induced pSTAT5 levels were categorized into tertiles, and the correlation between IL-7 levels and CD4+ T cell counts among subjects categorized as belonging in these tertiles is shown. Linear regression was used to predict the mean CD4+ T cell count based on endogenous plasma IL-7 levels in subjects with VL suppression. Numbers correspond to the Spearman ρ coefficient (Coeff.) and the P value for each tertile of IL-7-induced pSTAT5 levels. R2 indicates the amount of variance in CD4+ T cell count that is explained by plasma IL-7 levels within each tertile of IL-7 responsiveness. Numbers of subjects in the lower, middle, and upper tertiles of IL-7-induced pSTAT5 levels were 13, 27, and 34, respectively.

References

    1. Douek DC, Picker LJ, Koup RA. T cell dynamics in HIV-1 infection. Annu Rev Immunol. 2003;21:265–304. - PubMed
    1. Ma A, Koka R, Burkett P. Diverse functions of IL-2, IL-15, and IL-7 in lymphoid homeostasis. Annu Rev Immunol. 2006;24:657–79. - PubMed
    1. Marrack P, Bender J, Hildeman D, et al. Homeostasis of alpha beta TCR+ T cells. Nat Immunol. 2000;1:107–11. - PubMed
    1. Fry TJ, Connick E, Falloon J, et al. A potential role for interleukin-7 in T-cell homeostasis. Blood. 2001;97:2983–90. - PubMed
    1. Sandau MM, Winstead CJ, Jameson SC. IL-15 is required for sustained lymphopenia-driven proliferation and accumulation of CD8 T cells. J Immunol. 2007;179:120–5. - PubMed

Publication types