. 2009 Jun 15;48(12):1685-94.
doi: 10.1086/599040.

Isoniazid, rifampin, ethambutol, and pyrazinamide pharmacokinetics and treatment outcomes among a predominantly HIV-infected cohort of adults with tuberculosis from Botswana

Affiliations

Isoniazid, rifampin, ethambutol, and pyrazinamide pharmacokinetics and treatment outcomes among a predominantly HIV-infected cohort of adults with tuberculosis from Botswana

Sekai Chideya et al. Clin Infect Dis. .

Abstract

Background: We explored the association between antituberculosis drug pharmacokinetics and treatment outcomes among patients with pulmonary tuberculosis in Botswana.

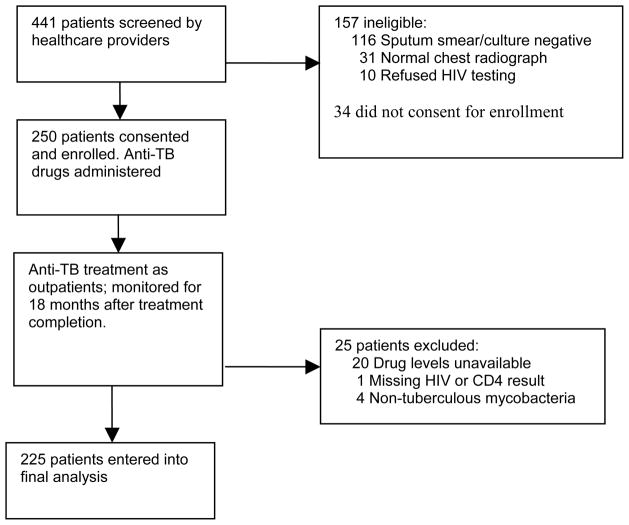
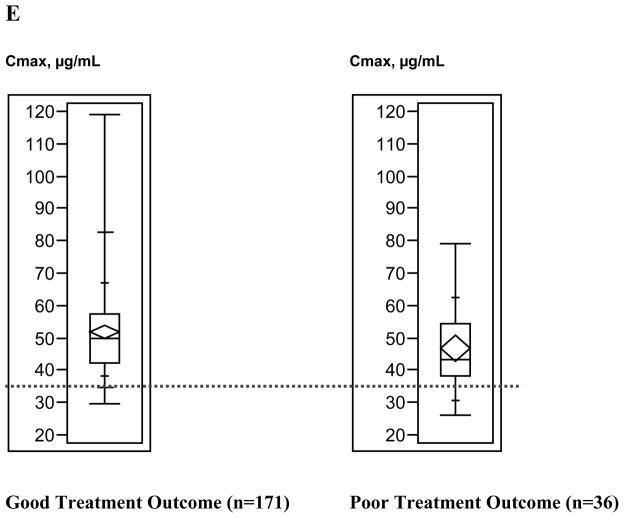
Methods: Consenting outpatients with tuberculosis had blood samples collected 1, 2, and 6 h after simultaneous isoniazid, rifampin, ethambutol, and pyrazinamide ingestion. Maximum serum concentrations (C(max)) and areas under the serum concentration time curve were determined. Clinical status was monitored throughout treatment.

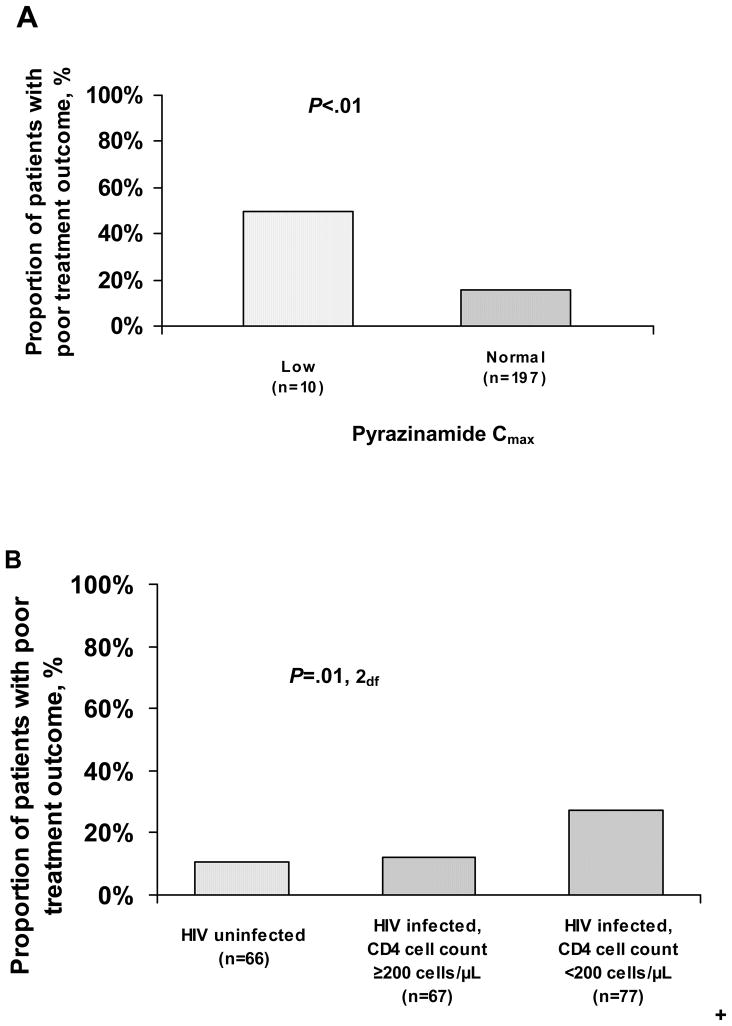
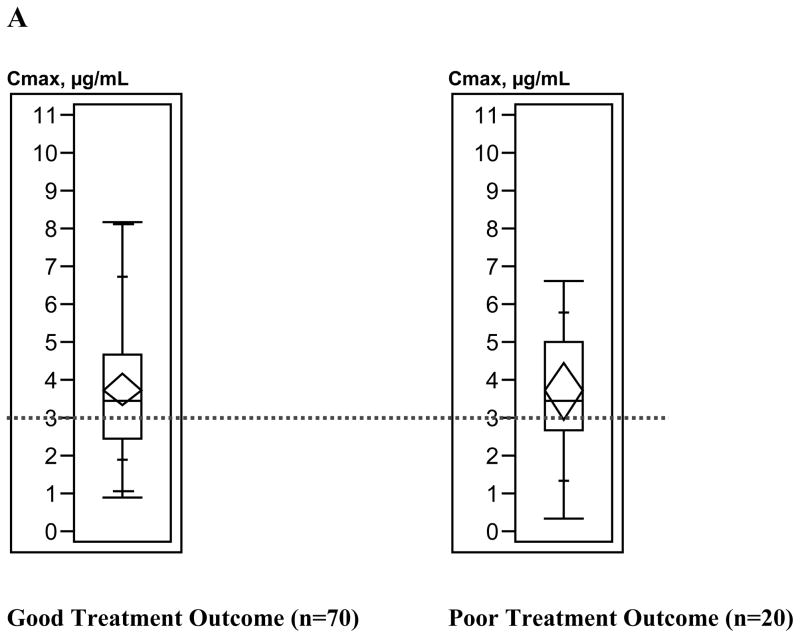
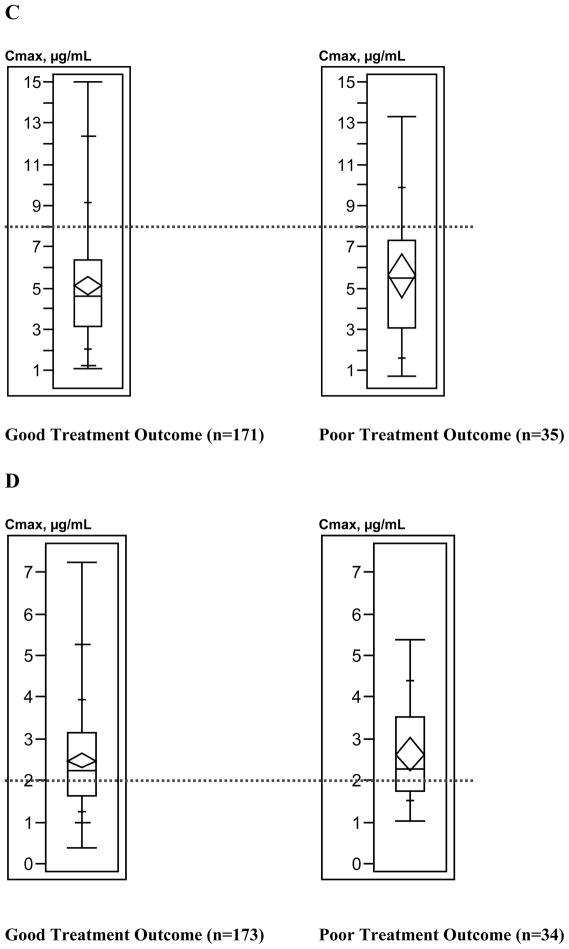
Results: Of the 225 participants, 36 (16%) experienced poor treatment outcome (treatment failure or death); 155 (69%) were infected with human immunodeficiency virus (HIV). Compared with published standards, low isoniazid C(max) occurred in 84 patients (37%), low rifampin C(max) in 188 (84%), low ethambutol C(max) in 87 (39%), and low pyrazinamide C(max) in 11 (5%). Median rifampin and pyrazinamide levels differed significantly by HIV status and CD4 cell count category. Only pyrazinamide pharmacokinetics were significantly associated with treatment outcome; low pyrazinamide C(max) was associated with a higher risk of documented poor treatment outcome, compared with normal C(max) (50% vs. 16%; P < .01). HIV-infected patients with a CD4 cell count <200 cells/microL had a higher risk of poor treatment outcome (27%) than did HIV-uninfected patients (11%) or HIV-infected patients with a CD4 cell count 200 cells/microL (12%; P = .01). After adjustment for HIV infection and CD4 cell count, patients with low pyrazinamide C(max) were 3 times more likely than patients with normal pyrazinamide C(max) to have poor outcomes (adjusted risk ratio, 3.38; 95% confidence interval, 1.84-6.22).

Conclusions: Lower than expected antituberculosis drug C(max) occurred frequently, and low pyrazinamide C(max) was associated with poor treatment outcome. Exploring the global prevalence and significance of these findings may suggest modifications in treatment regimens that could improve tuberculosis cure rates.


Conflict of interest statement

Potential conflicts of interest. All authors declare no conflict of interest with respect to this study.

Figures

Figure 1
Figure 1
Study profile. HIV, human immunodeficiency virus; TB, tuberculosis.
Figure 2
Figure 2
Proportion of patients with poor tuberculosis treatment outcome by maximum serum concentration (Cmax) of pyrazinamide (n=207; A) and human immunodeficiency virus (HIV) status and CD4 cell count category (n=210; B). P values based on χ2 tests comparing patients with either low or normal serum pyrazinamide Cmax values (A) and comparing patients across all 3 HIV status and CD4 cell count categories (B). Individual pairwise comparisons for HIV status and CD4 cell count categories were as follows: HIV-infected patients with CD4 cell count <200 cells/μL versus HIV-infected patients with CD4 cell count ≥ 200 cells/μL (P=.02, 1 degree of freedom [df]), HIV-infected patients with CD4 cell count <200 cells/μL versus HIV uninfected patients (P=.01, 1df); HIV-infected patients with CD4 cell count ≥ 200 cells/μL versus HIV uninfected patients (P=.81, 1df).
Figure 3
Figure 3
Box plots of antituberculosis drug maximum serum concentrations (Cmax) ranges by tuberculosis treatment outcome. A, Isoniazid (300-mg dose). B, Isoniazid (400-mg dose). C, Rifampin. D, Ethambutol. E, Pyrazinamide. Box lengths illustrate interquartile ranges, with the top of each box representing the 75th percentile, the bottom of each box representing the 25th percentile, and the horizontal line within each box indicating the 50th percentile (median) of the distribution. The diamond within each box represents the mean and 95% confidence interval around the mean. The vertical whisker lines extend from the minimum value to the maximum value. The dotted horizontal lines demarcate the Cmax below which each drug concentration was defined as low. Total sample sizes for individual drugs do not equal 225, because treatment outcome and Cmax could not be determined for all patients.
Figure 3
Figure 3
Box plots of antituberculosis drug maximum serum concentrations (Cmax) ranges by tuberculosis treatment outcome. A, Isoniazid (300-mg dose). B, Isoniazid (400-mg dose). C, Rifampin. D, Ethambutol. E, Pyrazinamide. Box lengths illustrate interquartile ranges, with the top of each box representing the 75th percentile, the bottom of each box representing the 25th percentile, and the horizontal line within each box indicating the 50th percentile (median) of the distribution. The diamond within each box represents the mean and 95% confidence interval around the mean. The vertical whisker lines extend from the minimum value to the maximum value. The dotted horizontal lines demarcate the Cmax below which each drug concentration was defined as low. Total sample sizes for individual drugs do not equal 225, because treatment outcome and Cmax could not be determined for all patients.

References

    1. Corbett EL, Watt CJ, Walker N, Maher D, Williams BG, Raviglione MC, Dye C. The growing burden of tuberculosis: global trends and interactions with the HIV epidemic. Arch Inter Med. 2003;163:1009–1021. - PubMed
    1. World Health Organization. [Accessed June 15, 2007];TB/HIV. http://www.who.int/tb/hiv/faq/en/index.html.
    1. Fox W, Ellard GA, Mitchison DA. Studies on the treatment of tuberculosis undertaken by the British Medical Research Council tuberculosis units, 1946–1986, with relevant subsequent publications. Int J Tuber Lung Dis. 1999;3(10):S231–S279. - PubMed
    1. Iseman MD. Tuberculosis therapy: past, present and future. Eur Resp J. 2002;20(Suppl 36):87s–94s. - PubMed
    1. Holdiness M. Clinical pharmacokinetics of the antituberculosis drugs. Clinical Pharmacokinetics. 1984;9:511–544. - PubMed

Publication types

MeSH terms