. 2009 Jul;100(7):1275-83.
doi: 10.1111/j.1349-7006.2009.01166.x. Epub 2009 Apr 21.

Level of reactive oxygen species induced by p21Waf1/CIP1 is critical for the determination of cell fate

Affiliations

Level of reactive oxygen species induced by p21Waf1/CIP1 is critical for the determination of cell fate

Takafumi Inoue et al. Cancer Sci. 2009 Jul.

Abstract

p21(WAF(1)/)(CIP(1)) is a well-known cell cycle regulatory protein which is overexpressed in several cancer cell lines, and known to determine cell fate. We generated three recombinant adenovirus vectors that expressed either the full-length p21 (Ad-p21F), a p21 mutant with a deletion of the C-terminal proliferative cell nuclear antigen (PCNA) binding domain (Ad-p21N), or a p21 mutant with a deletion of the N-terminal cyclin-dependent kinase binding domain (Ad-p21C). We transfected these vectors into five cancer cell lines. Premature senescence was induced in all of the lines only following transfection with Ad-p21N and Ad-p21F. In addition, apoptosis was also induced in LoVo and HCT116 cells that harbored wild-type p53 and the reactive oxygen species (ROS) level was higher than in senescent cells. Finally, the induction of apoptosis was inhibited by using siRNA to downregulate p53. This observation implies that there is a feedback signaling loop involving p21/ROS/p53 in apoptotic responses. It appears to be, at least in part, driven by high levels of p21 protein. Next, we investigated the cell death effect of endogenous p21 protein on cell fate using sodium butyrate (NaB). Treatment with 1 mM NaB or 2 to 5 mM NaB induced senescence or apoptosis, respectively. The level of intracellular ROS in 5 mM NaB treated cells was 2-fold higher, compared with that in 1 mM NaB treated cells. We also demonstrated that DNA damage response signals including ataxia telangiectasia mutated, gammaH2AX, and p38 MAPK were involved in NaB-induced cell death. The magnitude of intracellular ROS levels in response to p21 elicited either senescence or apoptosis in the cancer cell lines.


Figures

Figure 1
Figure 1
Three types of recombinant adenovirus vector, Ad‐p21F: wild‐type full‐length p21, Ad‐p21N: p21 that lacks proliferative cell nuclear antigen (PCNA) binding domain, and Ad‐p21C: p21 lacking cyclin‐dependent kinase (CDK) binding domain, (a) and the amino‐acid sequence of p21 deletion mutants are shown (b). (c) Detection of p21 protein in adenovirus transfected cells by western blots in SKOV3 and HeLa cells. All cancer cell lines were transfected with mock, Ad‐p21F, Ad‐p21N, or Ad‐p21C, and analyzed at 76 h after infection. p21 protein was expressed in all cell lines and detected as 21 kDa as full‐length bands. Mutant p21 was detected as 14 kDa bands. Each type of p21 protein (Ad‐p21N or Ad‐p21C) was defected by the antibody which recognized N‐terminal amino acids or C‐terminal amino acids, respectively.
Figure 2
Figure 2
Induction of senescence and apoptosis by p21 overexpression. (a) Ad‐p21‐N‐ and Ad‐p21‐F‐infected HeLa cells were enlarged, flattened, and were senescence‐associated β‐galactosidase (SA‐β‐gal)‐positive. No change in morphology was observed in cells transfected with the mock vector and Ad‐p21C. Bar = 10 µM (b) The populations of SA‐β‐gal‐positive cells (in HeLa, DLD‐1, SKOV3, LoVo, and HCT116 cells) after 48 h of infection are shown. Data represent the average of three independent experiments and SD are indicated by error bars. (c) When LoVo and HCT116 cells were transfected with 20 MOI Ad‐p21N and Ad‐p21F, cells were enlarged, flattened, and had increased SA‐β‐gal positivity. At 50 MOI (LoVo) and 40 MOI (HCT116), cells were detached from the plate and floating. The small panel on the lower right for 40 or 50 MOI shows positive cells with the TUNEL assay. Mock‐transfected cells showed no change in morphology and were not positive for the TUNEL assays. The populations of apoptotic cells in LoVo and HCT116 infected with 50 or 40 MOI Ad‐p21 after infection of 48 h are shown in right graph as indicated by the significant increase of subG1 fraction. Data represent the average of three independent experiments and SD are indicated by error bars. Bar = 10 µM (d) Western blot of p21 expression levels in LoVo cell lysates from mock‐, Ad‐p21C‐, Ad‐p21N‐, and Ad‐p21F‐transfected cells with different MOIs. (e) Western blot of p53 expression levels in LoVo and HeLa cell lysates from mock‐, Ad‐p21C‐, Ad‐p21N‐ and Ad‐p21F‐transfected cells with different MOIs.
Figure 2
Figure 2
Induction of senescence and apoptosis by p21 overexpression. (a) Ad‐p21‐N‐ and Ad‐p21‐F‐infected HeLa cells were enlarged, flattened, and were senescence‐associated β‐galactosidase (SA‐β‐gal)‐positive. No change in morphology was observed in cells transfected with the mock vector and Ad‐p21C. Bar = 10 µM (b) The populations of SA‐β‐gal‐positive cells (in HeLa, DLD‐1, SKOV3, LoVo, and HCT116 cells) after 48 h of infection are shown. Data represent the average of three independent experiments and SD are indicated by error bars. (c) When LoVo and HCT116 cells were transfected with 20 MOI Ad‐p21N and Ad‐p21F, cells were enlarged, flattened, and had increased SA‐β‐gal positivity. At 50 MOI (LoVo) and 40 MOI (HCT116), cells were detached from the plate and floating. The small panel on the lower right for 40 or 50 MOI shows positive cells with the TUNEL assay. Mock‐transfected cells showed no change in morphology and were not positive for the TUNEL assays. The populations of apoptotic cells in LoVo and HCT116 infected with 50 or 40 MOI Ad‐p21 after infection of 48 h are shown in right graph as indicated by the significant increase of subG1 fraction. Data represent the average of three independent experiments and SD are indicated by error bars. Bar = 10 µM (d) Western blot of p21 expression levels in LoVo cell lysates from mock‐, Ad‐p21C‐, Ad‐p21N‐, and Ad‐p21F‐transfected cells with different MOIs. (e) Western blot of p53 expression levels in LoVo and HeLa cell lysates from mock‐, Ad‐p21C‐, Ad‐p21N‐ and Ad‐p21F‐transfected cells with different MOIs.
Figure 3
Figure 3
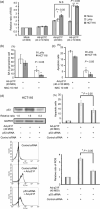
Reactive oxygen species (ROS) levels in cancer cell lines in response to p21 expression levels. (a) ROS levels were evaluated by FACS analysis after staining HeLa, LoVo and HCT116 cells with the aminophenyl fluorescein (APF) fluorescent probe. Relative ratio of the geometric mean that is the average of the logarithm of the linear value for events expressed as the anti‐log in Ad‐p21C‐ (40 MOI) and Ad‐p21F (20 MOI or 40 MOI)‐infected cells as compared to the control (20 MOI). Generated ROS levels were significantly higher in the cancer cells infected with 20 MOI Ad‐p21F than in controls and 40–50 MOI Ad‐p21C‐infected cells, *P < 0.05. In LoVo and HCT116 cells, generated ROS levels were significantly higher in the cancer cells infected with 40–50 MOI Ad‐p21F than those in 20 MOI Ad‐p21F‐infected cells, **P < 0.05. Apoptosis was induced in the former and senescence in the latter. (b) Senescence induced by p21‐overexpression was inhibited by N‐acetyl‐L‐cystein (NAC) (ROS scavenger). LoVo and HCT116 cells were cultured in 10 mM NAC and were infected with 20 MOI Ad‐p21F. The ratio of senescence‐associated β‐galactosidase (SA‐β‐gal)‐positive cells after 74 h of the infection was significantly decreased in the presence of NAC. Results represent mean values of three experiments, and the error bar shows the SD. (c) Induction of apoptosis with 50 MOI Ad‐p21F was also inhibited by the addition of NAC in LoVo and HCT116 cells, as indicated by the significant decrease of the subG1 fraction. Results represent mean values of three experiments, and the error bars show the SD. (d) p53‐siRNA inhibited apoptotis induction by p21. Western blot analysis of p53 expression in lysates from Ad‐p21F (40 MOI)‐infected HCT116 cells in the absence or presence of control‐siRNA and p53‐siRNA is shown. Induction of apoptosis by p21 was suppressed by p53‐siRNA in HCT116 cells, as indicated by the significant decrease in the subG1 fraction (upper graph). The shift to the right due to increased fluorescence corresponds to an increase in the intracellular levels of ROS. The black line indicates the mean fluorescence values in the control siRNA treated cells (lower left figure). The ROS level was significantly decreased in the presence of p53‐siRNA (P < 0.05) (lower right graph). Results represent mean values of three experiments, and the error bar shows the SD.
Figure 4
Figure 4
(a) Effect of sodium butyrate (NaB) on cell cycle analysis and the induction of cell death. DNA contents of HeLa and HCT116 cells with or without NaB for 24 h were analyzed by flow cytometry. NaB treatment reduced the percentage of cells in the S phase and triggered the accumulation of cells in the G2/M phase in HCT116 treated with 1.0 mM NaB. (b) Treatment with 1.0 mM NaB induced morphological change in HCT116 cells that included enlargement and flattening as well as an increase in the number of senescence‐associated β‐galactosidase (SA‐β‐gal)‐positive cells (arrows). Bar = 10 µM. (c) Western blot of p21 expression levels in HCT116 cell lysates from mock‐, Ad‐p21N‐, or Ad‐p21F‐ transfected cells with different MOIs compared to NaB‐treated cells at different concentrations.
Figure 5
Figure 5
Enhancement of reactive oxygen species (ROS) levels in cancer cell lines in response to sodium butyrate (NaB). (a) ROS levels were evaluated by FACS analysis after staining HCT116 cells with the aminophenyl fluorescein (APF) fluorescent probe. The ROS levels in apoptotic cells treated with 1.0 mM NaB are significantly higher than those in senescent cells induced by 5.0 mM NaB (P < 0.05). Data represent the average of three independent experiments and SD are indicated by error bars. (b) Treatment of N‐acetyl‐L‐cystein (NAC) reduced the proportion of cells accumulating in the G2/M phase and the ratio of senescent cells following NaB treatment. HCT116 cells were cultured with 0.5 mM NaB in the presence or absence of 0.5 mM NAC for 24 h. (c) ROS level (left graph) and the ratio of senescent cells (right graph) after 96 h of treatment significantly decreased in the presence of NAC (P < 0.05) compared to when NAC was absent. Results represent the mean values of three experiments, and the error bars show the SD.
Figure 6
Figure 6
Sodium butyrate (NaB) induced the expression of proteins associated with double strand break (DSB). (a) Western blot of ataxia telangiectasia mutated (ATM), phosphorylated H2AX (γH2AX), p53, phosphorylated p38 MAPK, p21, and MAPK after treatment with NaB for 48 h. (b) The level of γH2AX protein in cells treated with 2.0 mM NaB for 24 h was higher than in cells treated with 1.0 mM NaB, a level which induced senescence. Levels of γH2AX associated with the type determination of cell death.

Similar articles

Cited by

References

    1. Vaziri H, West MD, Allsopp RC et al . ATM‐dependent telomere loss in aging human diploid fibroblasts and DNA damage lead to the posttranslational activation of p53 protein involving poly (ADP‐ribose) polymerase. EMBO J 1997; 16: 6018–33. - PMC - PubMed
    1. Von Zglinicki T. Telomeres and replicative senescence: Is it only length that counts? Cancer Lett 2001; 168: 111–6. - PubMed
    1. Di Leonardo A, Linke SP, Clarkin K, Wahl GM. DNA damage triggers a prolonged p53‐dependent G1 arrest and long‐term induction of Cip1 in normal fibroblasts. Genes Dev 1994; 8: 2540–51. - PubMed
    1. Campisi J. Cellular senescence as a tumor‐suppressor mechanism. Trends Cell Biol 2001; 11: S27–S31. - PubMed
    1. Dotto G. p21 (WAF1/CIP1): more than a break to the cell cycle? Biochim Biophys Acta 2000; 1471: M43–M56. - PubMed

Publication types

MeSH terms

Substances