. 2009;10(5):R50.
doi: 10.1186/gb-2009-10-5-r50. Epub 2009 May 11.

Insights into the regulation of intrinsically disordered proteins in the human proteome by analyzing sequence and gene expression data

Affiliations

Insights into the regulation of intrinsically disordered proteins in the human proteome by analyzing sequence and gene expression data

Yvonne J K Edwards et al. Genome Biol. 2009.

Abstract

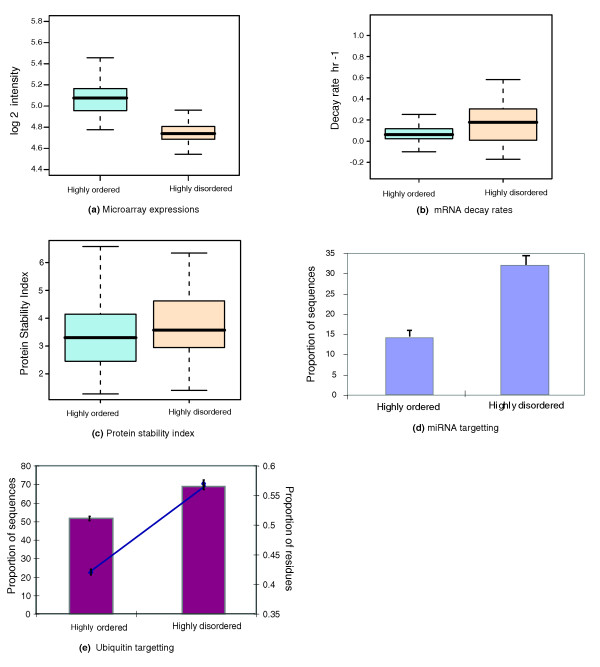
Background: Disordered proteins need to be expressed to carry out specified functions; however, their accumulation in the cell can potentially cause major problems through protein misfolding and aggregation. Gene expression levels, mRNA decay rates, microRNA (miRNA) targeting and ubiquitination have critical roles in the degradation and disposal of human proteins and transcripts. Here, we describe a study examining these features to gain insights into the regulation of disordered proteins.

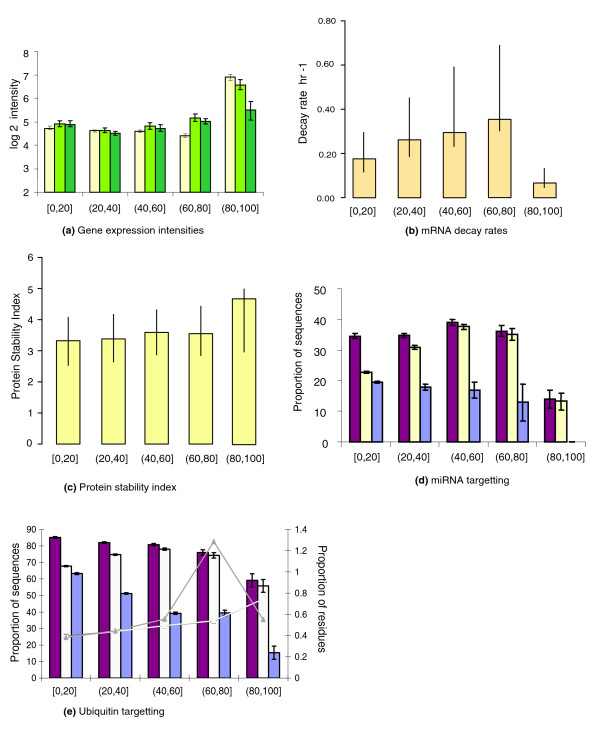
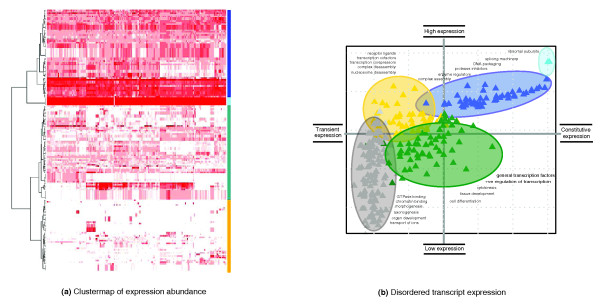
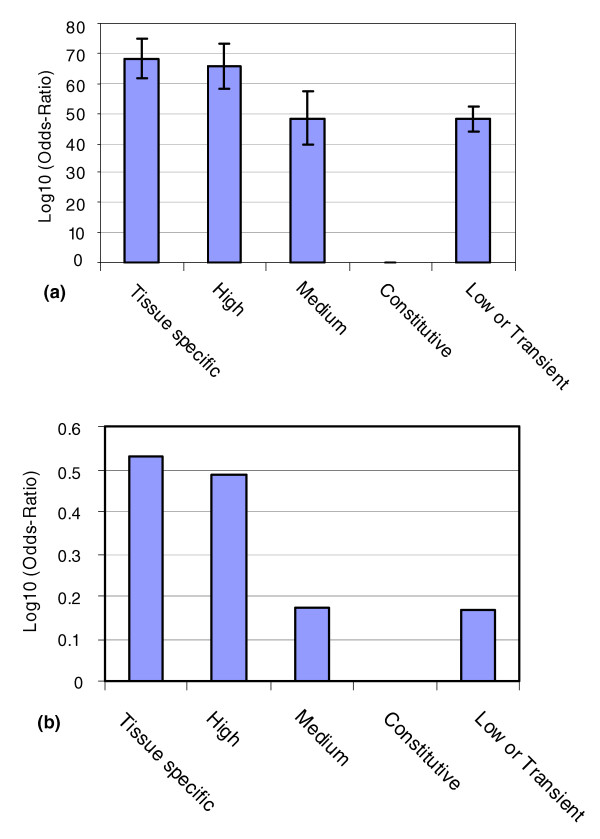
Results: In comparison with ordered proteins, disordered proteins have a greater proportion of predicted ubiquitination sites. The transcripts encoding disordered proteins also have higher proportions of predicted miRNA target sites and higher mRNA decay rates, both of which are indicative of the observed lower gene expression levels. The results suggest that the disordered proteins and their transcripts are present in the cell at low levels and/or for a short time before being targeted for disposal. Surprisingly, we find that for a significant proportion of highly disordered proteins, all four of these trends are reversed. Predicted estimates for miRNA targets, ubiquitination and mRNA decay rate are low in the highly disordered proteins that are constitutively and/or highly expressed.

Conclusions: Mechanisms are in place to protect the cell from these potentially dangerous proteins. The evidence suggests that the enrichment of signals for miRNA targeting and ubiquitination may help prevent the accumulation of disordered proteins in the cell. Our data also provide evidence for a mechanism by which a significant proportion of highly disordered proteins (with high expression levels) can escape rapid degradation to allow them to successfully carry out their function.


Figures

Figure 1
Figure 1
Properties of highly ordered and highly disordered proteins. (a) Box-plot distributions of the average expression levels for the transcripts encoding the highly ordered and the highly disordered proteins. (b) Box-plot of mRNA decay rates for the highly ordered and highly disordered proteins. (c) Box-plot of protein stability values. (d) The percentage of transcripts likely to be regulated by miRNA (y-axis) for the transcripts encoding the highly ordered and the highly disordered proteins. (e) The percentage of the proteins with one or more predicted ubiquitination sites (principal y-axis, burgundy bar chart) in the highly ordered and the highly disordered datasets; and the percentage of residues predicted as ubiquitination sites (secondary y-axis, navy line plot) versus different amounts of disorder.
Figure 2
Figure 2
Correlation of features with percentage of disorder in the proteome. (a) Variation in absolute transcript expression as the percentage of disorder increases in the proteome (yellow bars). The bar charts represent the average sample expression for the groups of transcripts separated according to the percentage range (x-axis) of the total disordered residues in the encoded proteins. The y-axis scale represents log2 absolute expression. Expression levels for the transcripts with MF and BP GO terms at level 4 are shown as light green and dark green bars, respectively. (b) Variation of mRNA decay rate as disorder increases in the proteome. mRNA decay rates versus the percentage bins of disordered residues are shown. (c) Variation of protein stability as disorder increases in the proteome. The stability index versus the percentage bins of disordered residues are shown. (d) The proportion of protein coding transcripts targeted by miRNA (y-axis) as the percentage of disorder increases in the proteome. The datasets for the transcripts encoding the disordered proteins (burgundy) and ordered proteins (mauve) and the proteome (yellow) are shown. (e) The percentage of the proteins with one or more predicted ubiquitination sites against the percentage of disorder (principal y-axis, bar charts); and the percentage of residues predicted as ubiquitination sites against the percentage of disorder (secondary y-axis, line plots). The transcripts encoding the disordered proteins, the ordered proteins and the proteome are shown in burgundy, mauve and yellow (respectively).
Figure 3
Figure 3
A summary of expression profiles for the highly disordered proteins. (a) The heat map displays four distinct transcript groups; constitutively expressed ribosomal subunits (light blue), high expressors (dark blue), medium expressors (green) and tissue specific expressors (gold). The clustering method was Ward's hierarchical clustering using Euclidean distances calculated over the absolute expression data matrix. Red colors indicate significantly high expression values (P < 0.001) within a sample tissue or cell line. (b). Summary of expression-function trends for highly disordered transcripts. Log10 of the number of tissues in which the transcript is expressed (x-axis); log10 expression of the average magnitude of expression within each tissue (y-axis). The points have been jittered for overlap using a normally distributed noise value of 0.05 on the log10 scale.
Figure 4
Figure 4
Summary of transcripts encoding highly disordered proteins as putative miRNA targets associated with expression profiles. (a) The percentage of the transcripts as predicted targets of miRNA (y-axis) versus the different datasets (x-axis) that comprise transcripts with different patterns of gene expression (Table 3). The error bars represent the confidence in the percent value according to different sample sizes for the different groups. (b) The log10 odds-ratio (y-axis) discriminates categories as under- and over-represented in relation to being a predicted miRNA target.

References

    1. Dunker AK, Lawson JD, Brown CJ, Williams RM, Romero P, Oh JS, Oldfield CJ, Campen AM, Ratliff CM, Hipps KW, Ausio J, Nissen MS, Reeves R, Kang C, Kissinger CR, Bailey RW, Griswold MD, Chiu W, Garner EC, Obradovic Z. Intrinsically disordered protein. J Mol Graph Model. 2001;19:26–59. doi: 10.1016/S1093-3263(00)00138-8. - DOI - PubMed
    1. Dunker AK, Brown CJ, Lawson JD, Iakoucheva LM, Obradovic Z. Intrinsic disorder and protein function. Biochemistry. 2002;41:6573–6582. doi: 10.1021/bi012159+. - DOI - PubMed
    1. Dunker AK, Cortese MS, Romero P, Iakoucheva LM, Uversky VN. Flexible nets. The roles of intrinsic disorder in protein interaction networks. FEBS J. 2005;272:5129–5148. doi: 10.1111/j.1742-4658.2005.04948.x. - DOI - PubMed
    1. Uversky VN, Oldfield CJ, Dunker AK. Showing your ID: intrinsic disorder as an ID for recognition, regulation and cell signaling. J Mol Recognit. 2005;18:343–384. doi: 10.1002/jmr.747. - DOI - PubMed
    1. Hegyi H, Schad E, Tompa P. Structural disorder promotes assembly of protein complexes. BMC Struct Biol. 2007;7:65. doi: 10.1186/1472-6807-7-65. - DOI - PMC - PubMed

Publication types

LinkOut - more resources