Genomic and genetic analyses of diversity and plant interactions of Pseudomonas fluorescens
- PMID: 19432983
- PMCID: PMC2718517
- DOI: 10.1186/gb-2009-10-5-r51
Genomic and genetic analyses of diversity and plant interactions of Pseudomonas fluorescens
Abstract
Background: Pseudomonas fluorescens are common soil bacteria that can improve plant health through nutrient cycling, pathogen antagonism and induction of plant defenses. The genome sequences of strains SBW25 and Pf0-1 were determined and compared to each other and with P. fluorescens Pf-5. A functional genomic in vivo expression technology (IVET) screen provided insight into genes used by P. fluorescens in its natural environment and an improved understanding of the ecological significance of diversity within this species.
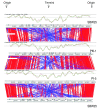
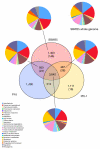
Results: Comparisons of three P. fluorescens genomes (SBW25, Pf0-1, Pf-5) revealed considerable divergence: 61% of genes are shared, the majority located near the replication origin. Phylogenetic and average amino acid identity analyses showed a low overall relationship. A functional screen of SBW25 defined 125 plant-induced genes including a range of functions specific to the plant environment. Orthologues of 83 of these exist in Pf0-1 and Pf-5, with 73 shared by both strains. The P. fluorescens genomes carry numerous complex repetitive DNA sequences, some resembling Miniature Inverted-repeat Transposable Elements (MITEs). In SBW25, repeat density and distribution revealed 'repeat deserts' lacking repeats, covering approximately 40% of the genome.
Conclusions: P. fluorescens genomes are highly diverse. Strain-specific regions around the replication terminus suggest genome compartmentalization. The genomic heterogeneity among the three strains is reminiscent of a species complex rather than a single species. That 42% of plant-inducible genes were not shared by all strains reinforces this conclusion and shows that ecological success requires specialized and core functions. The diversity also indicates the significant size of genetic information within the Pseudomonas pan genome.
Figures


Similar articles
-
Comparative genomics of plant-associated Pseudomonas spp.: insights into diversity and inheritance of traits involved in multitrophic interactions.PLoS Genet. 2012 Jul;8(7):e1002784. doi: 10.1371/journal.pgen.1002784. Epub 2012 Jul 5. PLoS Genet. 2012. PMID: 22792073 Free PMC article.
-
Type III secretion in plant growth-promoting Pseudomonas fluorescens SBW25.Mol Microbiol. 2001 Sep;41(5):999-1014. doi: 10.1046/j.1365-2958.2001.02560.x. Mol Microbiol. 2001. PMID: 11555282
-
Mobile genetic elements in the genome of the beneficial rhizobacterium Pseudomonas fluorescens Pf-5.BMC Microbiol. 2009 Jan 13;9:8. doi: 10.1186/1471-2180-9-8. BMC Microbiol. 2009. PMID: 19144133 Free PMC article.
-
Genomic, genetic and structural analysis of pyoverdine-mediated iron acquisition in the plant growth-promoting bacterium Pseudomonas fluorescens SBW25.BMC Microbiol. 2008 Jan 14;8:7. doi: 10.1186/1471-2180-8-7. BMC Microbiol. 2008. PMID: 18194565 Free PMC article.
-
Protein secretion systems of Pseudomonas aeruginosa and P fluorescens.Biochim Biophys Acta. 2003 Apr 1;1611(1-2):223-33. doi: 10.1016/s0005-2736(03)00059-2. Biochim Biophys Acta. 2003. PMID: 12659964 Review.
Cited by
-
The complete genome sequence of the plant growth-promoting bacterium Pseudomonas sp. UW4.PLoS One. 2013;8(3):e58640. doi: 10.1371/journal.pone.0058640. Epub 2013 Mar 13. PLoS One. 2013. PMID: 23516524 Free PMC article.
-
The effect of iron limitation on the transcriptome and proteome of Pseudomonas fluorescens Pf-5.PLoS One. 2012;7(6):e39139. doi: 10.1371/journal.pone.0039139. Epub 2012 Jun 18. PLoS One. 2012. PMID: 22723948 Free PMC article.
-
Pseudomonas fluorescens SBW25 produces furanomycin, a non-proteinogenic amino acid with selective antimicrobial properties.BMC Microbiol. 2013 May 20;13:111. doi: 10.1186/1471-2180-13-111. BMC Microbiol. 2013. PMID: 23688329 Free PMC article.
-
Total substitution and partial modification of the set of non-ribosomal peptide synthetases clusters lead to pyoverdine diversity in the Pseudomonas fluorescens complex.Front Microbiol. 2024 Aug 19;15:1421749. doi: 10.3389/fmicb.2024.1421749. eCollection 2024. Front Microbiol. 2024. PMID: 39224222 Free PMC article.
-
Investigation of the Amycolatopsis sp. strain ATCC 39116 vanillin dehydrogenase and its impact on the biotechnical production of vanillin.Appl Environ Microbiol. 2013 Jan;79(1):81-90. doi: 10.1128/AEM.02358-12. Epub 2012 Oct 12. Appl Environ Microbiol. 2013. PMID: 23064333 Free PMC article.
References
Publication types
MeSH terms
Grants and funding
LinkOut - more resources
Full Text Sources
Other Literature Sources
Molecular Biology Databases

