. 2009 May 11:9:13.
doi: 10.1186/1475-2867-9-13.

Nucleic acid distribution pattern as a possible biomarker for metabolic activities of neoplastic cells: a digitally-aided fluorescence microscopy study on normal and neoplastic lymphocytes of acute and chronic canine lymphocytic leukemia

Affiliations

Nucleic acid distribution pattern as a possible biomarker for metabolic activities of neoplastic cells: a digitally-aided fluorescence microscopy study on normal and neoplastic lymphocytes of acute and chronic canine lymphocytic leukemia

Godwin N Isitor et al. Cancer Cell Int. .

Abstract

Background: Metabolic states of neoplastic cells are increasingly being relied upon for diagnostic and prognostic assessment of neoplastic conditions. The nucleic acid distribution pattern of cells in general, in terms of degree of condensation of the nuclear chromatin and overall spread of the nucleic acid within the nuclear and cytoplasmic compartments, can reflect the metabolic state of the cell. This simple but logical concept appears not be put into consideration to date as numerous attempts are being made towards formulating reliable biomarkers for rapid diagnosis, prognosis and subsequent therapeutic interventions for neoplastic conditions. We comparatively evaluated nucleic acid distribution patterns of normal lymphocytes and neoplastic cells of lymphocytic lineage, employing light and fluorescence microscopy procedures, as well as digital imaging analytical methods.

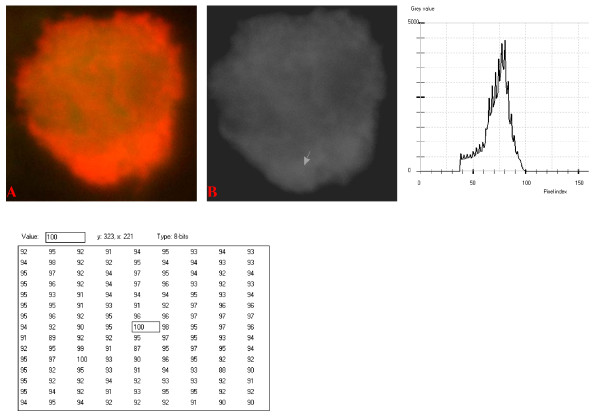
Results: The results demonstrate distinctiveness in the pattern of nucleic acid distribution for the normal lymphocytes and three lymphocytic neoplastic cell-types of canine lymphocytic leukemia that are categorized as small, intermediate and large neoplastic lymphocytes. Variably-shaped cytoplasmic processes laden with single-stranded nucleic acids (SSNA) were observed for the small and intermediate-sized neoplastic lymphocytes, compared with large neoplastic lymphocytes and the normal lymphocytes; the latter two categories of cells being virtually devoid of similar processes. Prominent cytoplasmic and nuclear clumps of SSNA, indicative of a higher rate of metabolic activity, were also observed within the neoplastic cells compared with fewer and narrower SSNA of the normal cells.

Conclusion: The comparative relative increases of SSNA in cytoplasmic processes and other cellular areas of small and intermediate-sized neoplastic lymphocytes is reflective of greater metabolic activity in neoplastic cells in general compared with their normal cellular counterparts.


Figures

Figure 1
Figure 1
Thin blood smear from a normal dog, stained with Wright's-Giemsa stain. Two small lymphocytes are evident within the smear. Image was acquired at 100× objective lens magnification. Bar = 6 μm.
Figure 2
Figure 2
Thin blood smear images of normal lymphocytes from healthy dogs; Wright-Giemsa stain (A, B); fluorescence microscopy images, stained with acridine orange (C, D, E, F) (Capture_6-12-05, Capture_8-12-05). Bar = 6 μm. The normal lymphocytes, as evidenced in panels A and B, have high nuclear to cytoplasmic ratio, and lack cytoplasmic processes as shown in both Wright-Giemsa and acridine orange-stained preparations. The fluorescing images show a distinct pattern of diffuse yellow-green DSNA fluorescence alongside punctate interconnected channel-like clumps of red SSNA fluorescence within the nuclear regions. Different stages of metabolic activity of the cells are reflected by variable degree of fluorescence by the cells. Narrow cytoplasmic rims of the cells are characterized by intense red SSNA fluorescence.
Figure 3
Figure 3
Wright-Giemsa-stained blood smear images (A, B), and fluorescence microscopy images (C, D) of canine acute lymphocytic leukemia cells (N197605x.tif; Capture_10-11-05, Capture_14-11-05). The smaller neoplastic lymphocytes in panel A are equivalent to the fluorescing images in panels C, while the image of the large neoplastic lymphocyte in panel B is equivalent to the fluorescing cell in panels D. Original images were acquired at 100 objective lens magnification. Bar = 6 μm. Note the diffuse green DSNA and red SSNA fluorescence within the nuclear regions, compared to the cytoplasmic region with only red SSNA fluorescence. The smaller neoplastic cells have high nuclear to cytoplasmic ratio compared to the larger cells. Erythrocytes are devoid of any nucleic acid fluorescence.
Figure 4
Figure 4
Higher magnification of fluorescence microscopy images of the neoplastic cells, showing small and large neoplastic cells. Original images were acquired at 100 objective lens magnification. Bar = 6 μm. Narrow cytoplasmic rim with processes laden with SSNA fluorescence are evident in the smaller neoplastic cells on the left. Cytoplasmic clumps of SSNA fluorescence are also quite evident in both cell-types. Nuclear fluorescence of the small neoplastic cells is characterized by diffuse yellow-green DSNA fluorescence with punctate, interconnected, channel-like, clumpy crimson-red SSNA fluorescence. Note the relative sizes of the small and large neoplastic cells, as well as the more oval outline of the nucleus of the large neoplastic cell which is also more eccentric, compared to the smaller cells. Nucleolar subdomains (yellow arrows) are evident in the large neoplastic cell. Non-fluorescing cisternal network (green arrows) is evident in the cytoplasm of the large cell.
Figure 5
Figure 5
Higher magnified fluorescence microscopy images, showing the large neoplastic cell and a normal appearing lymphocyte (Lower left). The insert represents equivalent large neoplastic cell prepared through routine Wright's stain, light microscopy method. Original images were acquired at 100 objective lens magnification. Bar = 6 μm. The nuclear region of the large neoplastic cell presents narrow clumps of dull green DSNA fluorescence and punctate areas of larger more diffuse clumps of red SSNA fluorescence. Nucleolar subdomain are shown as contiguous clumps of red SSNA fluorescence (Arrows). Non-fluorescing cisternal network, equivalent to the vesiculated pale structure in the Wright-stained image of the insert, is also evident in an eccentric area of the large neoplastic cell. Note the outline of the faint red SSNA fluorescence areas within the nuclear region of the lower left image of the normal-appearing lymphocyte; the distribution of which appears channel-like and interconnected. The normal-appearing cell is located close to the cytoplasmic area of the large neoplastic cell with non-fluorescing cisternal structures.
Figure 6
Figure 6
Fluorescence microscopy image of canine acute lymphocytic leukemia blood smear (Capture_14-11-05), showing an intermediate neoplastic cell. Bar = 6 μm. Note the presence of cytoplasmic processes, and a slightly more copious cytoplasm compared to those of the small neoplastic lymphocytes shown in Figure 4. The non-fluorescent cisternal structures are present (arrows) within the cytoplasm, but fewer than those of the large neoplastic cells. Nuclear fluorescent pattern is also similar to those of the small neoplastic cells.
Figure 7
Figure 7
Wright-Giemsa-stained blood smear image (A) and fluorescence microscopy images (B, C, D, E) of canine acute lymphocytic leukemia cells (Capture_10-11-05; Capture_14-11-05), showing intermediate neoplastic cells with variable cytoplasmic processes. Original images were acquired at 100 objective lens magnification. Bar = 6 μm. A process of induction of normal appearing smaller lymphocytes by the neoplastic cells appears to be taking place (panels B and D). Chunks of cytoplasmic processes laden with SSNA materials are being extruded from some of the neoplastic cells.
Figure 8
Figure 8
Wright-Giemsa stained blood smear image (A), and fluorescence microscopy image (B) of canine chronic lymphocytic leukemia cells (Capture_5-6-06). Original images were acquired at 100 objective lens magnification. Bar = 6 μm. Note the characteristic clumping of the lymphocytes in both panels; the clumping being more pronounced in the fluorescence microscopy equivalent image (panel B).
Figure 9
Figure 9
Higher magnification of the cells shown in Figure 5B. Original image was acquired at 100 objective lens magnification. Bar = 6 μm. Punctate areas of red SSNA fluorescence are distinct as interconnected clumps amongst the diffuse light green DSNA fluorescence in their nuclear regions.
Figure 10
Figure 10
24-bit fluorescence (A) and 8-bit gray-tone (B) images of normal dog small lymphocyte. Subtracted 30 to remove background pixels; added 33 to set highest reference pixel point to 100 as shown by the point of the arrow in panel B corresponding to the value 100 in the adjoining Table. Note the positively sloping mountain-like curve, skewed to the right and with 17 spikes which are mostly located at the top of the curve. The sides of the curve are extremely steep.
Figure 11
Figure 11
24-bit fluorescence (A) and 8-bit gray-tone (B) images of normal dog small lymphocyte. Subtracted 63 to remove background pixels; added 18 to set highest reference pixel point to 100 as shown by the point of the arrow in panel B corresponding to the value 100 in the adjoining Table. Note the positively sloping mountain-like curve with 23 spikes which are mostly located at the top of the curve. The sides of the curve are steep, while a set of spikes are more extruded at the middle of the curve.
Figure 12
Figure 12
24-bit fluorescence (A) and 8-bit gray-tone (B) images of normal dog small lymphocyte. Subtracted 55 to remove background pixels; added 18 to set highest reference pixel point to 100 as shown by the point of the arrow in panel B corresponding to the value 100 in the adjoining Table. The curve has a fairly extended shoulder at its left side. Note 5 spikes which are mostly located at the peak of the curve, while minute spikes project from the shoulder.
Figure 13
Figure 13
24-bit fluorescence (A) and 8-bit gray-tone (B) images of normal dog small lymphocyte. Subtracted 60 to remove background pixels; added 40 to set highest reference pixel point to 100 as shown by the point of the arrow in panel B corresponding to the value 100 in the adjoining Table. The curve is more mountain-like than that of Fig. 12. Note 6 spikes which are mostly located towards the peak of the curve, while minute spikes project from the shoulder.
Figure 14
Figure 14
24-bit fluorescence (A) and 8-bit gray-tone (B) images of small neoplastic lymphocyte. Subtracted 65 to remove background pixels; added 37 to set highest reference pixel point to 100 as shown by the point of arrow in panel B corresponding to the value 100 in the adjoining Table. The mountain-like curve has an extended shoulder at its left side. Note 9 spikes are mostly located at the broad-based peak of the curve, while minute spikes project from its shoulder.
Figure 15
Figure 15
24-bit fluorescence (A) and 8-bit gray-tone (B) images of small neoplastic lymphocyte. Subtracted 50 to remove background pixels; added 36 to set highest reference pixel point to 100 as shown by the point of arrow in panel B corresponding to the value 100 in the adjoining Table. The curve is fairly similar to that of Fig. 14.
Figure 16
Figure 16
24-bit fluorescence (A) and 8-bit gray-tone (B) images of small neoplastic lymphocyte. Subtracted 55 to remove background pixels; added 36 to set highest reference pixel point to 100 as shown by the point of arrow in panel B corresponding to the value 100 in the adjoining Table. The curve has a narrower peak, and 9 spikes mostly at the sides of the peak. It also has a left shoulder with minute spikes.
Figure 17
Figure 17
24-bit fluorescence (A) and 8-bit gray-tone (B) images of intermediate neoplastic lymphocyte. Subtracted 51 to remove background pixels; added 28 to set highest reference pixel point to 100 as shown by the point of arrow in panel B corresponding to the value 100 in the adjoining Table. The curve is similar to that of Fig. 16; its left shoulder with minute spikes is more extended.
Figure 18
Figure 18
24-bit fluorescence (A) and 8-bit gray-tone (B) images of intermediate neoplastic lymphocyte. Subtracted 50 to remove background pixels; added 18 to set highest reference pixel point to 100 as shown by the point of arrow in panel B corresponding to the value 100 in the adjoining Table. The curve is fairly similar to that in Fig. 17.
Figure 19
Figure 19
24-bit fluorescence (A) and 8-bit gray-tone (B) images of intermediate neoplastic lymphocyte. Subtracted 40 to remove background pixels; no addition to set highest reference pixel point to 100 as shown by the point of arrow in panel B corresponding to the value 100 in the adjoining Table. The curve has 2 main peaks flanking a trough-like region with numerous spikes. The left side of the curve is steep.
Figure 20
Figure 20
24-bit fluorescence (A) and 8-bit gray-tone (B) images of large neoplastic lymphocyte. Subtracted 50 to remove background pixels; added 23 to set highest reference pixel point to 100 as shown by the point of arrow in panel B corresponding to the value 100 in the adjoining Table. The curve is similar to that of intermediate neoplastic lymphocyte shown in Fig. 17 and 18. It is sloped at both sides, and has a main peak, narrowed at the top, and with 10 spikes at the sides. A left shoulder is also present.
Figure 21
Figure 21
24-bit fluorescence (A) and 8-bit gray-tone (B) images of large neoplastic lymphocyte. Subtracted 50 to remove background pixels; added 24 to set highest reference pixel point to 100 as shown by the point of arrow in panel B corresponding to the value 100 in the adjoining Table. The curve is fairly similar to that in Fig. 20, except for more pronounced spikes at the left shoulder of the latter; the outline of the shoulder is sigmoid-like.
Figure 22
Figure 22
24-bit fluorescence (A) and 8-bit gray-tone (B) images of large neoplastic lymphocyte. Subtracted 60 to remove background pixels; added 45 to set highest reference pixel point to 100 as shown by the point of arrow in panel B corresponding to the value 100 in the adjoining Table. The curve is quite different from those of same categories (Figs. 20 and 21). It has a mountain-like appearance with 11 spikes located at the peak.

Similar articles

References

    1. Kornberg RD, Lorch Y. Twenty-five years of the nucleosome, fundamental particle of the eukaryote chromosome. Cell. 1999;98:285–294. doi: 10.1016/S0092-8674(00)81958-3. - DOI - PubMed
    1. Owen LN. Serial transplantation of canine lymphocytic leukemia. Eur J Cancer. 1971;7:525–528. - PubMed
    1. Workman HC, Vernau W. Chronic lymphocytic leukemia in dogs and cats: the veterinary perspective. Vet Clin North Am Small Anim Pract. 2003;33:1379–99. doi: 10.1016/S0195-5616(03)00120-7. - DOI - PubMed
    1. Chapman AL, Bopp WJ, Torres J, Jr, Cohen H. An electron microscopic study of the cell types in canine lymphoma and leukemia. J Comp Pathol. 1981;91:331–40. doi: 10.1016/0021-9975(81)90002-5. - DOI - PubMed
    1. Cohen H, Chapman AL, Ebert JW, Bopp WJ, Gravelle CR. Cellular transmission of canine lymphoma and leukemia in beagles. J Natl Cancer Inst. 1970;45:1013–23. - PubMed

LinkOut - more resources