. 2009 Jul;104(1):161-78.
doi: 10.1093/aob/mcp107. Epub 2009 May 11.

Genome size in Hieracium subgenus Hieracium (Asteraceae) is strongly correlated with major phylogenetic groups

Affiliations

Genome size in Hieracium subgenus Hieracium (Asteraceae) is strongly correlated with major phylogenetic groups

Jindrich Chrtek Jr et al. Ann Bot. 2009 Jul.

Abstract

Background and aims: Hieracium subgenus Hieracium is one of the taxonomically most intricate groups of vascular plants, due to polyploidy and a diversity of breeeding systems (sexuality vs. apomixis). The aim of the present study was to analyse nuclear genome size in a phylogenetic framework and to assess relationships between genome size and ploidy, breeding system and selected ecogeographic features.

Methods: Holoploid and monoploid genome sizes (C- and Cx-values) of 215 cultivated plants from 89 field populations of 42 so-called 'basic' Hieracium species were determined using propidium iodide flow cytometry. Chromosome counts were available for all analysed plants, and all plants were tested experimentally for their mode of reproduction (sexuality vs. apomixis). For constructing molecular phylogenetic trees, the external transcribed spacer region of nuclear ribosomal DNA was used.

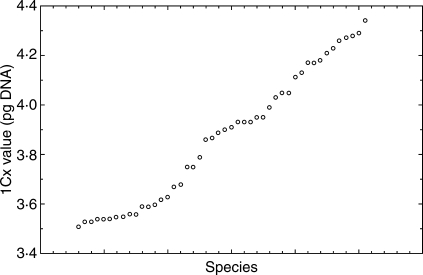
Key results: The mean 2C values differed up to 2.37-fold among different species (from 7.03 pg in diploid to 16.67 in tetraploid accessions). The 1Cx values varied 1.22-fold (between 3.51 and 4.34 pg). Variation in 1Cx values between conspecific (species in a broad sense) accessions ranged from 0.24% to 7.2%. Little variation (not exceeding the approximate measurement inaccurracy threshold of 3.5%) was found in 33 species, whereas variation higher than 3.5% was detected in seven species. Most of the latter may have a polytopic origin. Mean 1Cx values of the three cytotypes (2n, 3n and 4n) differed significantly (average of 3.93 pg in diploids, 3.82 pg in triploids and 3.78 pg in tetraploids) indicating downsizing of genomes in polyploids. The pattern of genome size variation correlated well with two major phylogenetic clades which were composed of species with western or eastern European origin. The monoploid genome size in the 'western' species was significantly lower than in the 'eastern' ones. Correlation of genome size with latitude, altitude and selected ecological characters (light and temperature) was not significant. A longitudinal component was only apparent for the whole data set, but absent within the major lineages.

Conclusions: Phylogeny was the most important factor explaining the pattern of genome size variation in Hieracium sensu stricto, species of western European origin having significantly lower genome size in comparison with those of eastern European origin. Any correlation with ecogeographic variables, including longitude, was outweighed by the divergence of the genus into two major phylogenetic lineages.


Figures

Fig. 1.
Fig. 1.
1Cx-value variation in 46 taxa of Hieracium subgenus Hieracium.
Fig. 2.
Fig. 2.
Variation of genome size among diploids, triploids and tetraploids (all samples). 1Cx values of all accessions are shown. Differences between diploids and triploids, and between diploids and tetraploids are significant. The box indicates the interquartile (25–75%) range, the small square within the box is the median. The whiskers indicate minimum and maximum values.
Fig. 3.
Fig. 3.
Phylogenetic analysis of ETS sequences based on all accessions. A Bayesian consensus tree of 3002 saved trees is shown with posterior probabilities above branches. The maximum likelihood tree has the same topology; bootstrap values are indicated below branches. Hieracium subgenus Hieracium (=Hieracium sensu stricto) is monophyletic, but species relationships are completely unresolved when hybrids are included in the analysis. Support for the two subclusters is low.
Fig. 4.
Fig. 4.
Phylogenetic analysis of ETS sequences excluding interclade hybrid accessions. A Bayesian consensus tree of 1502 saved trees is shown with posterior probabilities above branches. The maximum likelihood tree has the same topology; bootstrap values are indicated below branches. After exclusion of hybrids based on character additivity, two major groups are resolved (referred to as ‘eastern’ and ‘western’ clades). Hybrid accessions composed of parents from both clades (interclade hybrids) are listed to the right. (W), Interclade hybrids with predominant ‘western’ ETS type; (E), interclade hybrids with predominant ‘eastern’ ETS type. Hieracium piliferum is a hybrid between ‘Hieraciumintybaceum and an ‘eastern’ clade taxon. For details about accessions, see Table 1 and Supplementary Data, available online.
Fig. 5.
Fig. 5.
Correlation of 1Cx values with phylogeny. Only accessions for which sequence data were available are included. (A) W1, ‘western’ clade accessions without H. transylvanicum; W2, ‘western’ clade accessions including H. transylvanicum; X, interclade hybrid accessions; E, accessions of the ‘eastern’ clade. (B) W1, W2 and E as before, hybrids divided into those with predominant ‘western’ [X(W)], equal (X) and predominant ‘eastern’ [X(E)] ETS sequence composition (see also Table 1). The box indicates the interquartile (25–75%) range, the small square within the box is the median. The whiskers indicate minimum and maximum values.
Fig. 6.
Fig. 6.
Distribution of 1Cx values versus longitudinal position of collection sites: (A) based on the complete set of accessions/populations (Spearman rank coefficient r = 0·562, P < 0·001); (B) based on a subset after excluding accessions of widely distributed species (H. bifidum, H. lachenalii, H. laevigatum, H. murorum, H. sabaudum and H. umbellatum; r = 0·617, P < 0·001).
Fig. 7.
Fig. 7.
Longitudinal component of genome size variation for accessions of known phylogenetic origin: (A) based on a complete set of ‘western’ and ‘eastern’ accessions/populations analysed by molecular methods (excluding interclade hybrid accessions; Spearman rank coefficient r = 0·656, P < 0·001); (B) based on a subset after excluding accessions of widely distributed species (H. bifidum, H. murorum and H. umbellatum; r = 0·688, P < 0·001); (C) based on a subset of accessions with ‘western’ ETS type (r = 0·161, P = 0·567); (D) based on subset of accessions with ‘eastern’ ETS type (r = 0·394, P = 0·245).

References

    1. Albach DC, Greilhuber J. Genome size variation and evolution in Veronica. Annals of Botany. 2004;94:897–911. - PMC - PubMed
    1. Arnheim N. Concerted evolution of multigene families. In: Nei M, Koehn R, editors. Evolution of genes and proteins. Sunderland, MA: Sinauer; 1983. pp. 38–61.
    1. Arumuganathan K, Earle ED. Nuclear DNA content of some important plant species. Plant Molecular Biology Reports. 1991;9:208–218.
    1. Baack EJ, Whitney KD, Rieseberg LH. Hybridization and genome size evolution: timing and magnitude of nuclear DNA content increases in Helianthus homoploid hybrid species. New Phytologist. 2005;167:623–630. - PMC - PubMed
    1. Bancheva S, Greilhuber J. Genome size in Bulgarian Centaurea s.l. (Asteraceae) Plant Systematics and Evolution. 2006;257:95–117.

Publication types