. 2009 Jul 3;284(27):18282-91.
doi: 10.1074/jbc.M109.008631. Epub 2009 May 11.

Contribution of adipose triglyceride lipase and hormone-sensitive lipase to lipolysis in hMADS adipocytes

Affiliations

Contribution of adipose triglyceride lipase and hormone-sensitive lipase to lipolysis in hMADS adipocytes

Véronic Bezaire et al. J Biol Chem. .

Abstract

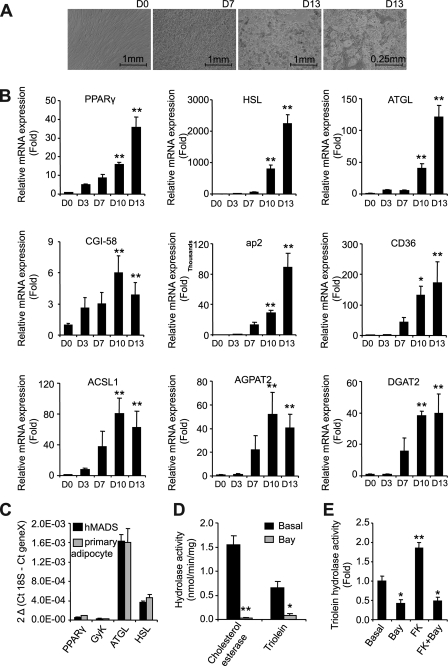
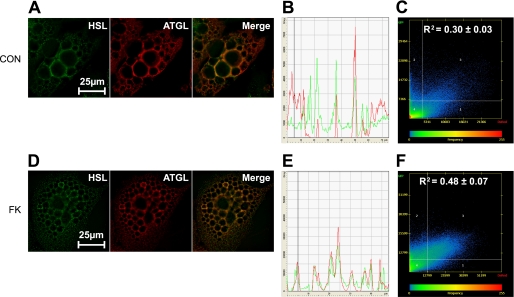
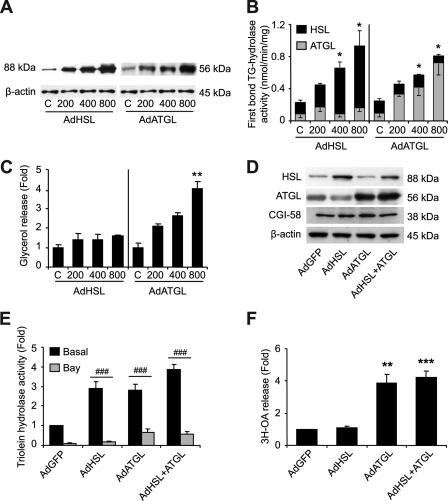
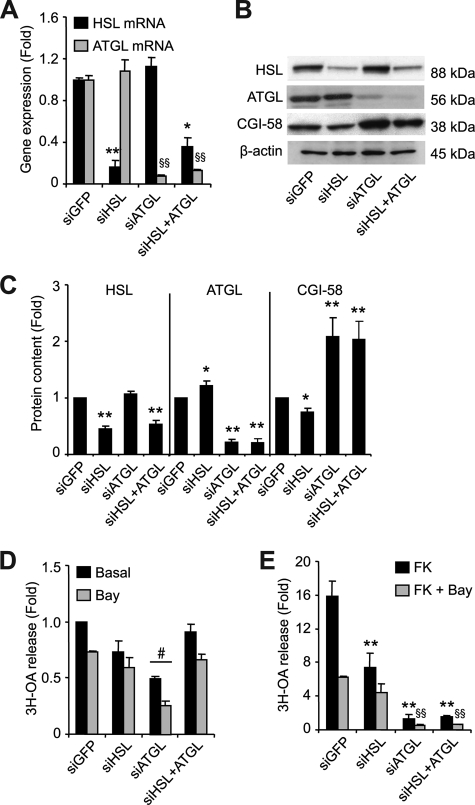
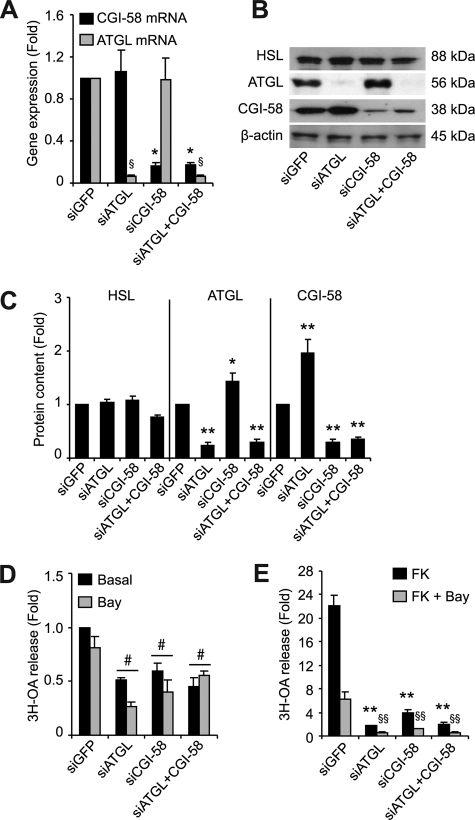
Lipolysis is the catabolic pathway by which triglycerides are hydrolyzed into fatty acids. Adipose triglyceride lipase (ATGL) and hormone-sensitive lipase (HSL) have the capacity to hydrolyze in vitro the first ester bond of triglycerides, but their respective contributions to whole cell lipolysis in human adipocytes is unclear. Here, we have investigated the roles of HSL, ATGL, and its coactivator CGI-58 in basal and forskolin-stimulated lipolysis in a human white adipocyte model, the hMADS cells. The hMADS adipocytes express the various components of fatty acid metabolism and show lipolytic capacity similar to primary cultured adipocytes. We show that lipolysis and fatty acid esterification are tightly coupled except in conditions of stimulated lipolysis. Immunocytochemistry experiments revealed that acute forskolin treatment promotes HSL translocation from the cytosol to small lipid droplets and redistribution of ATGL from the cytosol and large lipid droplets to small lipid droplets, resulting in enriched colocalization of the two lipases. HSL or ATGL overexpression resulted in increased triglyceride-specific hydrolase capacity, but only ATGL overexpression increased whole cell lipolysis. HSL silencing had no effect on basal lipolysis and only partially reduced forskolin-stimulated lipolysis. Conversely, silencing of ATGL or CGI-58 significantly reduced basal lipolysis and essentially abolished forskolin-stimulated lipolysis. Altogether, these results suggest that ATGL/CGI-58 acts independently of HSL and precedes its action in the sequential hydrolysis of triglycerides in human hMADS adipocytes.


Figures

FIGURE 1.
FIGURE 1.
hMADS cells as a model to study human adipocyte metabolism. A, representative micrographs of hMADS cells at days 0, 7, and 13 of differentiation. B, gene expression of fatty acid metabolism genes throughout hMADS differentiation, expressed as fold induction from day 0. C, gene expression of differentiation markers in hMADS and primary adipocytes at day 13 of differentiation, expressed as 2ΔCt. GyK, glycerol kinase. D, cholesterol esterase and triolein hydrolase activity of hMADS cells in the presence and absence of Bay (10 μm) during the assay. E, triolein hydrolysis activity of hMADS cells pretreated with Bay (10 μm) and/or FK (1 μm). The data are presented as the means ± S.D. (n = 4). For one-way ANOVA, *, p < 0.05, significantly different from day 0 or basal condition.
FIGURE 2.
FIGURE 2.
Lipolysis and re-esterification fluxes in hMADS adipocytes. A, release of lipolytic products NEFA and glycerol with/without Bay (10 μm) and/or FK (1 μm). B, [3H-9,10]OA and glycerol release in the presence of Triacsin C (10 μm) with/without Bay (10 μm) and/or FK (1 μm). C, correlation of [3H-9,10]OA release and re-esterification fluxes. Re-esterification was calculated as follows: [([3H-9,10]OA release with Triacsin C - [3H-9,10]OA release without Triacsin C)/[3H-9,10]OA release with Triascin C]. D, [3H-9,10]OA release and re-esterification fluxes of hMADS with/without Bay (10 μm) and/or FK (1 μm). All of the lipolytic and re-esterification fluxes were measured over 3 h. The data are presented as the means ± S.E. (n = 4–5). For one-way ANOVA, * or §, p < 0.05, significantly different from own basal; for two-way ANOVA, #, p < 0.05, significantly different from basal condition.
FIGURE 3.
FIGURE 3.
Intracellular localization of HSL and ATGL before and after FK stimulation. Control (CON) and FK-treated cells were stained for ATGL and HSL and microscopy images were analyzed as described under “Experimental Procedures.” A and D, immunofluorescence images of one representative optical section after deconvolution in control and FK-treated cells. B and E, distribution of the staining across the cell for one representative optical section in control and FK-treated cells. C and F, colocalization scatterplots evaluated by Pearson colocalization coefficients as means from at least 150 optical sections from five different cells in control (0.30 ± 0.03) and FK-treated (0.48 ± 0.07) cells. Colocalization coefficients for control and treated cells differed significantly (p < 0.0001).
FIGURE 4.
FIGURE 4.
Assessment of HSL and ATGL overexpression in hMADS adipocytes. hMADS cells infected with adenoviruses containing the GFP gene alone or in tandem with human HSL and/or ATGL cDNA. m.o.i.s of HSL or ATGL ranged from 200 to 800 but were supplemented with GFP alone for a total m.o.i. of 800 in all conditions. A, Western blots of HSL and ATGL normalized to β-actin. B, theoretical HSL and ATGL first bond TG hydrolase activity of hMADS cells. Assuming that all three ester bonds of TG substrate (triolein) are cleaved during the in vitro assay (50), the activity of HSL was calculated as follows: [(TG hydrolase activity without Bay − TG hydrolase activity with Bay)/3]. The activity of ATGL is calculated from TG hydrolase activity in the presence of Bay. C, glycerol release. D, Western blots of HSL, ATGL, and CGI-58 in cytosolic fractions of hMADS adipocytes normalized to β-actin for single and dual adenoviral transductions of lipases at 400 m.o.i. E, cytosolic triolein hydrolase activity in the presence and absence of Bay (10 μm) during assays following single and double adenoviral transductions of lipases at 400 m.o.i. F, basal [3H-9,10]OA release with Triascin C (10 μm) following single and dual adenoviral transductions of lipases at 400 m.o.i. The data are presented as the means ± S.E. The experiments were performed in duplicate. For one-way ANOVA (n = 3), *, p < 0.05, significantly different from own control or AdGFP; for two-way ANOVA (n = 6), #, p < 0.05, significantly different from AdGFP condition.
FIGURE 5.
FIGURE 5.
Assessment of HSL and ATGL gene silencing in hMADS adipocytes. Control (siGFP) or gene-specific small interfering RNAs for HSL and/or ATGL were delivered into suspended adipocytes with a microporator and reseeded in DM. A, gene expression of HSL and ATGL expressed as fold induction over siGFP. B, Western blots of HSL, ATGL, and CGI-58 in cytosolic fractions of hMADS cells. C, densitometry analysis of Western blots normalized to β-actin in cytosolic fractions (n = 10). D, basal [3H-9,10]OA release with Triascin C (10 μm) in the presence and absence of Bay (10 μm). E, FK-stimulated [3H-9,10]OA release with Triacsin C (10 μm) in the presence and absence of Bay (10 μm) expressed as fold induction over basal levels. The data are presented as the means ± S.E. The experiments were performed in duplicate. Unless stated otherwise, for one-way ANOVA (n = 3), * or §, p < 0.05, significantly different from corresponding basal; for two-way ANOVA (n = 6), #, p < 0.05, significantly different from siGFP condition.
FIGURE 6.
FIGURE 6.
Assessment of CGI-58 gene silencing in hMADS adipocytes. Control (siGFP) or gene-specific small interfering RNAs for ATGL and/or CGI-58 were delivered into suspended adipocytes with a microporator and reseeded in DM. Gene expression and functional measurements were assessed on day 13, 6 days post-microporation. A, gene expression of ATGL and CGI-58 expressed as fold induction over siGFP. B, Western blot analyses in cytosolic fractions of hMADS cells. C, densitometry analysis of Western blots normalized to β-actin in cytosolic fractions (n = 10). D, basal [3H-9,10]OA release with Triascin C (10 μm) in the presence and absence of Bay (10 μm). E, FK-stimulated [3H-9,10]OA release with Triacsin C (10 μm) in the presence and absence of Bay (10 μm) expressed as fold induction over basal levels. The data are presented as the means ± S.E. The experiments were performed in duplicate. Unless stated otherwise, for one-way ANOVA (n = 3), * or §, p < 0.05, significantly different from corresponding siGFP; for two-way ANOVA (n = 6), #, p < 0.05, significantly different from siGFP condition.

References

    1. Belfrage P., Jergil B., Strålfors P., Tornqvist H. ( 1978) Adv. Exp. Med. Biol. 101, 113– 126 - PubMed
    1. Haemmerle G., Zimmermann R., Hayn M., Theussl C., Waeg G., Wagner E., Sattler W., Magin T. M., Wagner E. F., Zechner R. ( 2002) J. Biol. Chem. 277, 4806– 4815 - PubMed
    1. Zimmermann R., Strauss J. G., Haemmerle G., Schoiswohl G., Birner-Gruenberger R., Riederer M., Lass A., Neuberger G., Eisenhaber F., Hermetter A., Zechner R. ( 2004) Science 306, 1383– 1386 - PubMed
    1. Fredrikson G., Tornqvist H., Belfrage P. ( 1986) Biochim. Biophys. Acta 876, 288– 293 - PubMed
    1. Langin D., Arner P. ( 2006) Trends Endocrinol. Metab. 17, 314– 320 - PubMed

Publication types

MeSH terms