

Pandemic potential of a strain of influenza A (H1N1): early findings
- PMID: 19433588
- PMCID: PMC3735127
- DOI: 10.1126/science.1176062
Pandemic potential of a strain of influenza A (H1N1): early findings
Abstract
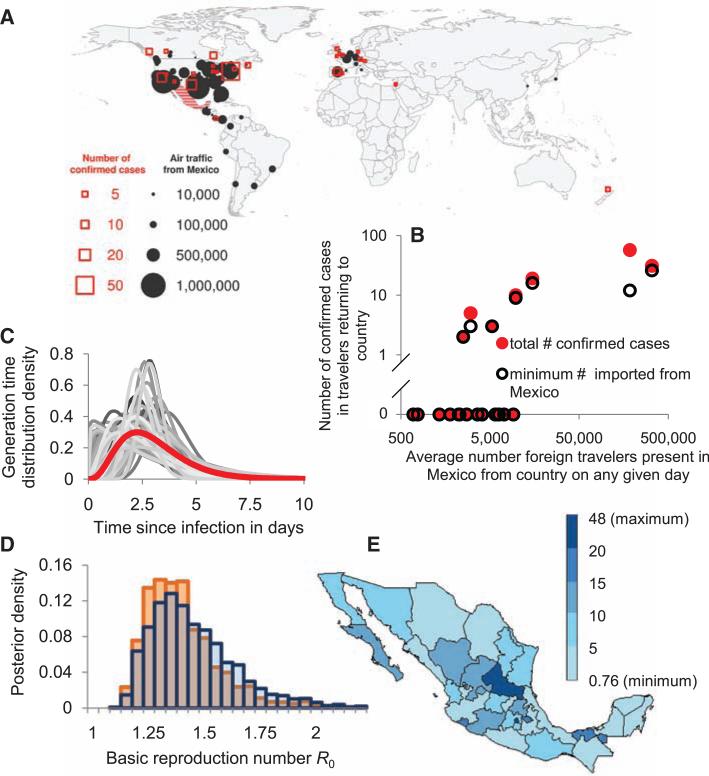
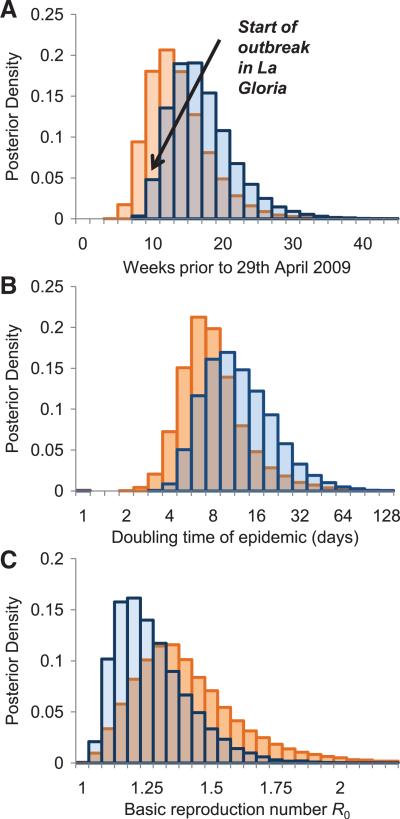
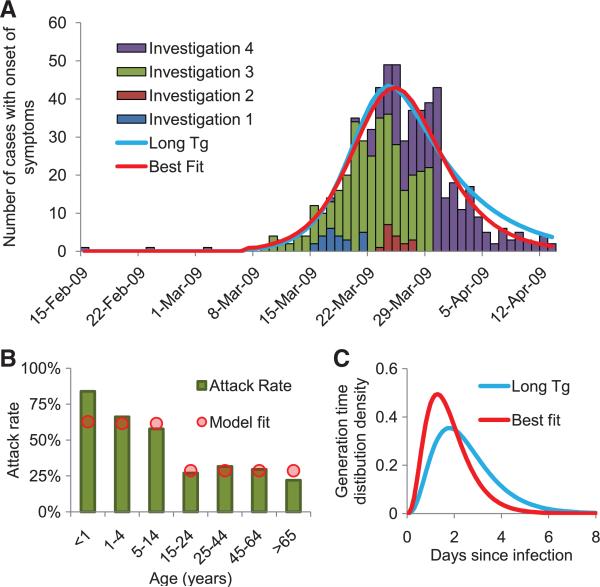
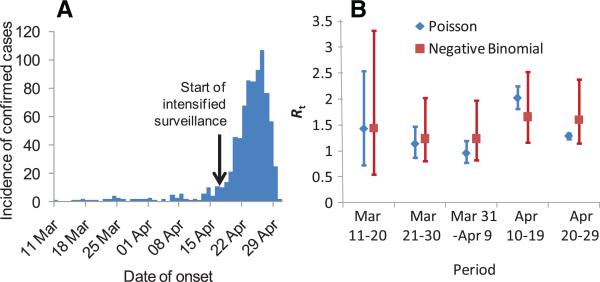
A novel influenza A (H1N1) virus has spread rapidly across the globe. Judging its pandemic potential is difficult with limited data, but nevertheless essential to inform appropriate health responses. By analyzing the outbreak in Mexico, early data on international spread, and viral genetic diversity, we make an early assessment of transmissibility and severity. Our estimates suggest that 23,000 (range 6000 to 32,000) individuals had been infected in Mexico by late April, giving an estimated case fatality ratio (CFR) of 0.4% (range: 0.3 to 1.8%) based on confirmed and suspected deaths reported to that time. In a community outbreak in the small community of La Gloria, Veracruz, no deaths were attributed to infection, giving an upper 95% bound on CFR of 0.6%. Thus, although substantial uncertainty remains, clinical severity appears less than that seen in the 1918 influenza pandemic but comparable with that seen in the 1957 pandemic. Clinical attack rates in children in La Gloria were twice that in adults (<15 years of age: 61%; >/=15 years: 29%). Three different epidemiological analyses gave basic reproduction number (R0) estimates in the range of 1.4 to 1.6, whereas a genetic analysis gave a central estimate of 1.2. This range of values is consistent with 14 to 73 generations of human-to-human transmission having occurred in Mexico to late April. Transmissibility is therefore substantially higher than that of seasonal flu, and comparable with lower estimates of R0 obtained from previous influenza pandemics.
Figures
Comment in
-
Influenza: H1N1 goes to school.Science. 2009 Aug 28;325(5944):1071-2; author reply 1072-3. doi: 10.1126/science.325_1071b. Science. 2009. PMID: 19713507 No abstract available.
-
Influenza: accounting for prior immunity.Science. 2009 Aug 28;325(5944):1071; author reply 1072-3. doi: 10.1126/science.325_1071a. Science. 2009. PMID: 19713508 No abstract available.
-
Influenza: making privileged data public.Science. 2009 Aug 28;325(5944):1072; author reply 1072-3. doi: 10.1126/science.325_1072a. Science. 2009. PMID: 19713511 No abstract available.
-
Estimation of Coronavirus Disease 2019 (COVID-19) Burden and Potential for International Dissemination of Infection From Iran.Ann Intern Med. 2020 May 19;172(10):699-701. doi: 10.7326/M20-0696. Epub 2020 Mar 16. Ann Intern Med. 2020. PMID: 32176272 Free PMC article. No abstract available.
-
Estimation of the COVID-19 burden in Egypt through exported case detection.Lancet Infect Dis. 2020 Aug;20(8):894. doi: 10.1016/S1473-3099(20)30233-4. Epub 2020 Mar 26. Lancet Infect Dis. 2020. PMID: 32222162 Free PMC article. No abstract available.
-
Estimation of COVID-19 burden in Egypt.Lancet Infect Dis. 2020 Aug;20(8):896-897. doi: 10.1016/S1473-3099(20)30319-4. Epub 2020 Apr 27. Lancet Infect Dis. 2020. PMID: 32353346 Free PMC article. No abstract available.
-
Estimation of COVID-19 burden in Egypt.Lancet Infect Dis. 2020 Aug;20(8):895-896. doi: 10.1016/S1473-3099(20)30318-2. Epub 2020 Apr 27. Lancet Infect Dis. 2020. PMID: 32353348 Free PMC article. No abstract available.
-
Estimation of COVID-19 burden in Egypt.Lancet Infect Dis. 2020 Aug;20(8):894-895. doi: 10.1016/S1473-3099(20)30329-7. Epub 2020 Apr 27. Lancet Infect Dis. 2020. PMID: 32353349 Free PMC article. No abstract available.
References
-
- México Dirección General Adjunta de Epidemiología Brote de influenza humana A H1N1 México. 2009 May 4 and 5;
-
- WHO [5 May 2009];Swine Influenza—Update 15. ( www.who.int/csr/don/2009_05_05/en/index.html)
-
- Glezen WP, Payne AA, Snyder DN, Downs TD. J. Infect. Dis. 1982;146:313. - PubMed
-
- Hollingsworth TD, Ferguson NM, Anderson RM. Nat. Med. 2006;12:497. - PubMed
Publication types
MeSH terms
Associated data
- Actions
- Actions
- Actions
- Actions
- Actions
- Actions
- Actions
- Actions
- Actions
- Actions
- Actions
- Actions
- Actions
- Actions
- Actions
- Actions
- Actions
- Actions
- Actions
- Actions
- Actions
- Actions
Grants and funding
LinkOut - more resources
Full Text Sources
Other Literature Sources
Medical
Miscellaneous
