. 2009 Jun;133(6):583-601.
doi: 10.1085/jgp.200810085. Epub 2009 May 11.

Mechanism of olfactory masking in the sensory cilia

Affiliations

Mechanism of olfactory masking in the sensory cilia

Hiroko Takeuchi et al. J Gen Physiol. 2009 Jun.

Abstract

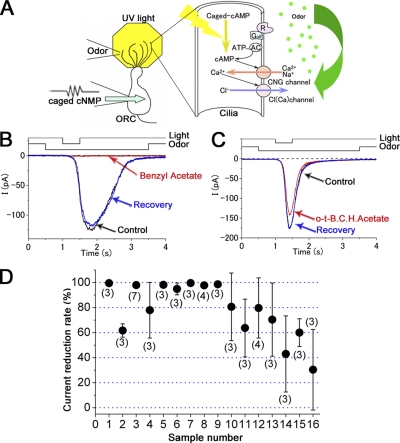
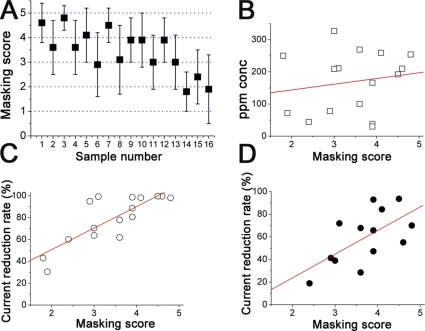
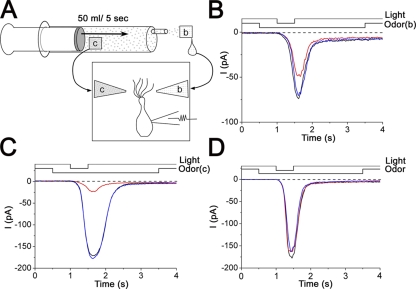
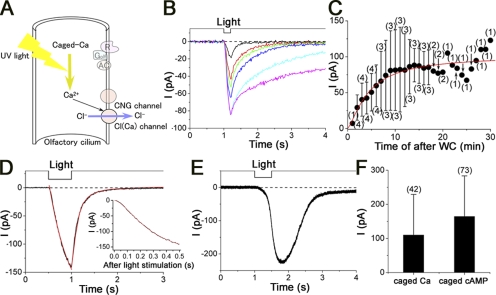
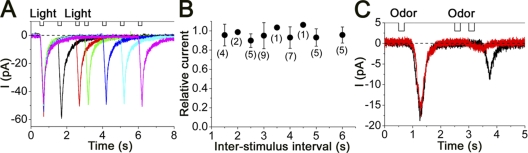
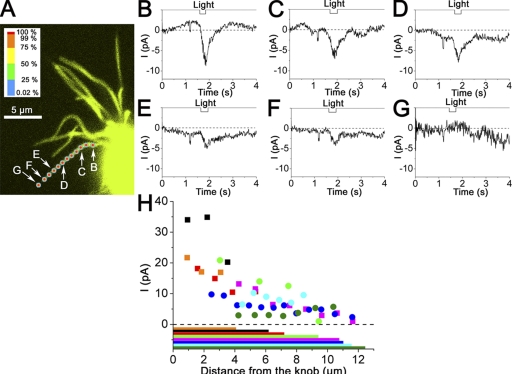
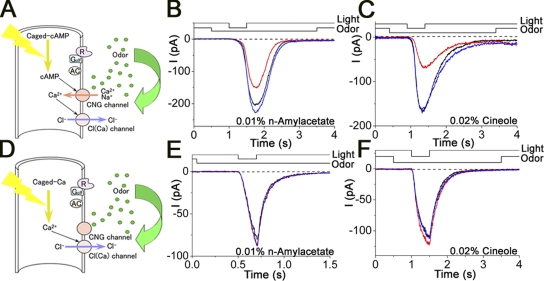
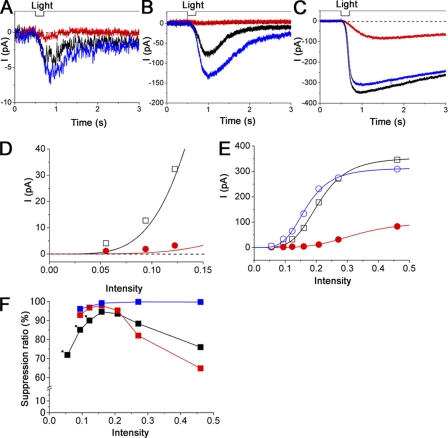
Olfactory masking has been used to erase the unpleasant sensation in human cultures for a long period of history. Here, we show a positive correlation between the human masking and the odorant suppression of the transduction current through the cyclic nucleotide-gated (CNG) and Ca2+-activated Cl- (Cl(Ca)) channels. Channels in the olfactory cilia were activated with the cytoplasmic photolysis of caged compounds, and their sensitiveness to odorant suppression was measured with the whole cell patch clamp. When 16 different types of chemicals were applied to cells, cyclic AMP (cAMP)-induced responses (a mixture of CNG and Cl(Ca) currents) were suppressed widely with these substances, but with different sensitivities. Using the same chemicals, in parallel, we measured human olfactory masking with 6-rate scoring tests and saw a correlation coefficient of 0.81 with the channel block. Ringer's solution that was just preexposed to the odorant-containing air affected the cAMP-induced current of the single cell, suggesting that odorant suppression occurs after the evaporation and air/water partition of the odorant chemicals at the olfactory mucus. To investigate the contribution of Cl(Ca), the current was exclusively activated by using the ultraviolet photolysis of caged Ca, DM-nitrophen. With chemical stimuli, it was confirmed that Cl(Ca) channels were less sensitive to the odorant suppression. It is interpreted, however, that in the natural odorant response the Cl(Ca) is affected by the reduction of Ca2+ influx through the CNG channels as a secondary effect. Because the signal transmission between CNG and Cl(Ca) channels includes nonlinear signal-boosting process, CNG channel blockage leads to an amplified reduction in the net current. In addition, we mapped the distribution of the Cl(Ca) channel in living olfactory single cilium using a submicron local [Ca2+]i elevation with the laser photolysis. Cl(Ca) channels are expressed broadly along the cilia. We conclude that odorants regulate CNG level to express masking, and Cl(Ca) in the cilia carries out the signal amplification and reduction evenly spanning the entire cilia. The present findings may serve possible molecular architectures to design effective masking agents, targeting olfactory manipulation at the nano-scale ciliary membrane.


Figures

Figure 1.
Figure 1.
Odorant suppression of cAMP-induced current in single ORCs. (A) Schema of experimental procedure and biochemical reactions in the olfactory cilia. Photolysis of caged cAMP induces a current response with CNG and Cl(Ca) components after bypassing the olfactory enzymatic cascade. Simultaneously, odorous chemicals were puff-applied to the cilia to investigate the effect on the transduction channels. (B) Effect of 0.1% benzyl acetate on the cAMP-induced current. After the light-induced current was recorded as a control (black), benzyl acetate was applied before the light stimulation to cover the response period observed in the control (red). After a 20-s interval, the light stimulation was again applied in the absence of chemical (blue) to observe the recovery. Downward deflection of the upper traces indicates the timing and duration of the light and odor stimulation. Holding potential (Vh) = −50 mV. Light stimulation was 0.48, as a relative value in our setup (see Takeuchi and Kurahashi, 2002). (C) Effect of 0.1% o-t-B.C.H.acetate on the cAMP-induced current. After the control (black), o-t-B.C.H.acetate was applied before the light stimulation (red). After a 20-s interval, light stimulation was applied in the absence of chemical (blue). Vh- = −50 mV. (D) Channel blocking score of 16 samples (see also Table I). Zero indicates no effect. Error bars indicate SD. Numbers in parentheses indicate the numbers of cells examined.
Figure 2.
Figure 2.
Human olfactory masking and correlation with the blockage of transduction current. (A) Human olfactory masking score. Data obtained with 16 chemical samples (see Table I) from 20 human subjects. Test odor used was iso-valeric acid, and sample numbers correspond to the numbers in Table I. Plots indicate means, and bars show SD. The higher masking scores indicate the greater masking effect. (B) Correlation between human olfactory masking score and ppm concentration. Note that both variables show no correlation (R = 0.17). (C) Correlation between human olfactory masking score and channel score. 0.1% nominal concentration. Note that both variables show positive correlation (R = 0.81). 16 data were obtained from Figs. 1 D and 2 A. (D) Correlation between human olfactory masking score and channel score. Data from 13 chemicals. Linear regression gave R of 0.62. 0.01% nominal concentration.
Figure 3.
Figure 3.
Blockage of cAMP-induced current by vapor-exposed Ringer's solution. (A) Procedure of the vapor exposure of Ringer's solution and its application to the cell under the recording. Odorant-containing solution (0.1%, 40 µl) was put to a filter paper (c) and was inserted in the 50-ml syringe to evaporate the odorant molecules for 15 min. The vapor was gently applied with a rate of 50 ml/5 s onto the filter paper wet by 40 µl of normal Ringer's solution (b). After the vapor-exposed solution was extracted, it was put into the puffer pipette. (B) Effect of vapor-exposed Ringer's on the cAMP-induced current. Odorant put into the syringe was 0.1% dihydromyrcenol. Vh = −50 mV. The light-induced current was recorded as a control (black). Next, light-induced current response was obtained in the presence of the vapor-exposed Ringer's stimulation (red). After a 20-s interval, current recovery (blue) was confirmed. Pressure of odorant stimulation was 50 kPa. Light intensity was 0.28. Downward deflection of the upper traces indicates the timing and duration of the light and odor stimulation. Vh = −50 mV. (C) Current suppression by a direct puff-application of 0.1% dihydromyrcenol. Vh = −50 mV. Different cell from B. (D) The same experiments as B, except that limonene 0.1% was used for the odorant. Vh = −50 mV.
Figure 4.
Figure 4.
Responses induced by caged Ca and caged cAMP. (A) Schema of caged Ca-induced current response. The response is caused by bypassing the receptor to CNG level. (B) Change in the current amplitude and prolongation of the falling phase after the establishment of WC recording configuration. The currents were obtained after WC in 2 (black), 3 (red), 4 (green), 5 (blue), 10 (light blue), and 15 (pink) min, respectively. Downward deflection of the upper trace indicates the timing and duration of the light stimulation. Vh = −50 mV. Light intensity was 0.48. (C) Change of the current amplitudes after WC. Plots indicate the mean, and the error bars show the SD. Numbers in parentheses indicate the number of examined cells. Red smooth line was drawn by the Hill fittings with Hill coefficient (nH) = 1.6, K1/2 = 4.4 min, and Imax = 101.6 pA. (D) Time course of the caged Ca-induced current response. Curve fitting was made with the single-exponential function (red, rising phase of the caged Ca-induced current was fitted by the Hill function [red] with nH of 1.6). Light stimulation was 0.48. (E) Responses induced by caged cAMP. Light stimulation was 0.48. (F) Comparison of response amplitudes induced by caged Ca and caged cAMP. There was a statistical significance with t test (P < 0.05). Numbers in parentheses indicate the numbers of cells examined. Vh = −50 mV.
Figure 5.
Figure 5.
Off-kinetics of the Ca2+-induced current. (A) Effect of cytoplasmic ATP and K+ for Ca2+ extrusion system in the cilia. Relaxation times (τ) were obtained from the exponential fitting of the falling phase in the wave forms at each time (see Fig. 4 D). Vh = −50 mV. Filled black squares, data obtained with 119 mM CsCl pipette solution and 0 mM ATP; filled red squares, data with 119 mM CsCl pipette solution and 1 mM ATP; filled green squares, data with 119 mM KCl and 2 mM ATP. Intensity, 0.48; duration, 200 ms. Plots indicate mean values, and the error bars show SD. Numbers in parentheses indicate the number of examined cells. (B) Voltage dependence of Ca2+ responses. Vh = −50 mV (black) as a control, Vh = +100 mV (red), and Vh = −50 mV (green) as a recovery. (C) Comparison between the falling phases at −50 and +100 mV. Data were obtained from B. Vh = −50 mV (black), Vh = +100 mV (red), and Vh = −50 mV (green). Falling phases were fitted by the single-exponential curve as smooth lines. τ: 91.6 ms (black), 343.3 ms (red), and 160.3 ms (green), respectively. Light intensity was 0.48. (D) Effect of lowered [Na+]o on the Ca2+-induced current in 110 NaCl bath solution (black), 0 mM Na puff application (red), and 110 NaCl bath solution (green). The opening diameter of the puffer was ∼3 µm. 0 mM Na solution was applied 2 s before the light stimulation and continued for 6 s Light stimulation was 0.48. Pressure of puff was 150 kPa. Vh = −50 mV.
Figure 6.
Figure 6.
Voltage and [Cl]o dependence of the current induced by the photolysis of caged Ca. (A) Caged Ca-induced currents recorded at various membrane potentials. Vh was changed from −60 to +80 mV. Downward deflection of the top trace indicates the timing and duration of the UV light stimulation. Light intensity was 0.48. (B) I-V relationship of conductance activated by UV photolysis. Data from A. (C) I-V relation of the Ca2+-induced current obtained by the ramp clamp with three different [Cl]o (black, 121.7 mM; red, 66.7 mM; green, 39.2 mM). Voltage range was −80 to +80 mV. Low Cl solution was superfused to the bath. (D) Plots of reversal potentials at various [Cl]o concentrations. Filled circles and vertical bars represent the average and SD of data (n = 3). The straight line was drawn by estimating the [Cl]i to be identical to the pipette solution, and it has a slope of −58 mV per 10-fold change of [Cl]o.
Figure 7.
Figure 7.
Intensity and duration dependence of the light-induced current response to caged Ca. (A) Membrane currents were recorded from various intensities (changed from 0.03 to 0.78). Duration, 200 ms. (B) Intensity–response relation of the light-induced current. Peak amplitudes of the current responses obtained from A were plotted against the intensity of the light stimulation. The smooth line shows the least-square fitting of data with the Hill equation. nH was 1.8. (C) Current responses were obtained with various durations (changed from 20 to 250 ms). Intensity, 0.48. (D) Time–response relation. Peak amplitudes of the current responses obtained from C were plotted against the intensity of the light stimulation. The smooth line was drawn by the least-square fitting of data by the Hill equation, with nH of 1.8. Vh = −50 mV.
Figure 8.
Figure 8.
Effect of niflumic acid. (A) Ca2+ responses induced by the photolysis. Black trace shows a control light response. Red trace shows a light-induced current under the presence of 1 mM (concentration in the puffer pipette) niflumic acid. Blue, recovery. Pressure was 100 kPa. Vh = −50 mV. Niflumic acid stimulations were applied 1 s before the light stimulation and continued for 3 s. (B) 2 mM niflumic acid stimulation (red). (C) 5 mM niflumic acid stimulation (red). (D) Dose–inhibition relation. Open circles indicate the data shown in Kleene (1993). Filled squares indicate data obtained from the present experiments, and error bars show SD. The numbers in parentheses indicate the examined cells. Filled circles indicate the values estimated from an assumption that the concentration of the niflumic acid was diluted 85 times with the surrounding media, and that the effect of niflumic acid is symmetric.
Figure 9.
Figure 9.
Current induced by double pulses; UV light and odor stimuli. (A) UV light double-pulse stimulation. Inter-stimulus intervals were 1, 2, 2.5, 3.5, 4.5, and 5.5 s, respectively. Vh = −50 mV. (B) Relative current responses were plotted against inter-stimulus interval. Error bar shows SD. Numbers in parentheses indicate the numbers of cells examined. (C) Membrane responses to double odorant pulses. Odorant (0.01% amyl acetate) was puff applied to the cell (pressure, 50 kPa). Inter-stimulus intervals were 2 and 2.5 s. Vh = −50 mV.
Figure 10.
Figure 10.
Spatial distribution of [Ca]i sensitivity along the single cilium. (A) Fluorescent image of a single cilium and the locations of the UV laser stimuli. Stimulus intensity is depicted as a color scaling that is independently shown with a scale bar (top left column; for detail, see Takeuchi and Kurahashi, 2008). (B–G) Waveforms of the current induced by the local laser irradiation. Cell was loaded with 10 mM of caged Ca. All ROIs were circular, and diameters were 1 µm (25 pixels) for filled squares or 0.52 µm (13 pixels) for filled circles. Vh, −50 mV. 100× lens. Laser wavelength, 351 and 364 nm. Output, 70%; transmission, 100%. Data were obtained from points indicated in A. Downward transients observed immediately before the responses are artifacts caused by the trigger signals to initiate the raster scan on LSM. (H) Relation between the distance from the knob and local current responses from eight cells. 100× lens. The lowest horizontal color bars indicate the length of the cilia of corresponding colored plots.
Figure 11.
Figure 11.
Effect of odorants on Cl component of response. (A) Schema of cAMP response generation in the olfactory transduction cascade. Cilia are loaded with 1 mM of caged cAMP. When the UV light stimulation is applied to the ciliary region, uncaged cAMP molecules open the CNG channel. Note that the light stimulation activates CNG and Cl(Ca) channels sequentially. (B) Current responses induced by the light stimulation during odorant stimulation (0.01% n-amyl acetate). After the control (black), light-induced current response was obtained under the odorant stimulation (red). Blue, current recovery. Vh = −50 mV. (C) Current responses induced by the light stimulation during odorant stimulation (0.02% cineole). Vh = −50 mV. (D) Schema of Ca2+ response generation in the olfactory transduction cascade. When the UV light stimulation is applied to the ciliary region, uncaged Ca2+ molecules open the Cl(Ca) channel. Note in this experiment that only Cl(Ca) channels are open, without affecting CNG channels. (E) Cl(Ca) current responses induced by the light stimulation during odorant stimulation (0.01% n-amyl acetate). Vh = −50 mV. (F) Cl(Ca) current responses induced by the light stimulation during odorant stimulation (0.02% cineole). Vh = −50 mV.
Figure 12.
Figure 12.
[cAMP]i dependence of the odorant suppression. (A) Current suppression by odorant at low light intensity (0.06). After the control (black), light-induced current response was obtained under the odorant stimulation (0.02% cineole, red). Blue, current recovery. Vh = −50 mV. Cineole was applied 0.5 s before the light stimulation and continued for 3 s. (B) Current suppression by odorant at medium light intensity (0.16). (C) Current suppression by odorant at high light intensity (0.46). A–C were obtained from the same cell. (D) Dose–response relation at low intensities. Data were obtained from A and additional data that are not presented. Open black squares, the control; filled red circles, suppressed currents. Plots were fitted by the Hill equation with nH of 4.5 and 4.4. (E) Intensity dependence of the dose–response relation. Open black squares, the control; filled red circles, suppressed current; open blue circles, the recovery. Plots were fitted by the Hill equation with nH of 4.5, 4.4, and 4.2, respectively. (F) Relation between intensity and suppression ratio. Black, red, cineole; blue, dihydromyrcenol. Asterisks show data obtained from D.

Similar articles

Cited by

References

    1. Antolin S., Matthews H.R. 2007. The effect of external sodium concentration on sodium-calcium exchange in frog olfactory receptor cells.J. Physiol. 581:495–503 - PMC - PubMed
    1. Bakalyar H.A., Reed R.R. 1990. Identification of a specialized adenylyl cyclase that may mediate odorant detection.Science. 250:1403–1406 - PubMed
    1. Boccaccio A., Menini A. 2006. Fast adaptation in mouse olfactory sensory neurons does not require the activity of phosphodiesterase.J. Gen. Physiol. 128:171–184 - PMC - PubMed
    1. Boccaccio A., Menini A. 2007. Temporal development of cyclic nucleotide-gated and Ca2+-activated Cl- currents in isolated mouse olfactory sensory neurons.J. Neurophysiol. 98:153–160 - PubMed
    1. Brunet L.J., Gold G.H., Ngai J. 1996. General anosmia caused by a targeted disruption of the mouse olfactory cyclic nucleotide-gated cation channel.Neuron. 4:681–693 - PubMed

Publication types

MeSH terms