

Restoration and reversible expansion of the osteoblastic hematopoietic stem cell niche after marrow radioablation
- PMID: 19433859
- PMCID: PMC2745851
- DOI: 10.1182/blood-2008-10-183459
Restoration and reversible expansion of the osteoblastic hematopoietic stem cell niche after marrow radioablation
Abstract
Adequate recovery of hematopoietic stem cell (HSC) niches after cytotoxic conditioning regimens is essential to successful bone marrow transplantation. Yet, very little is known about the mechanisms that drive the restoration of these niches after bone marrow injury. Here we describe a profound disruption of the marrow microenvironment after lethal total body irradiation of mice that leads to the generation of osteoblasts restoring the HSC niche, followed by a transient, reversible expansion of this niche. Within 48 hours after irradiation, surviving host megakaryocytes were observed close to the endosteal surface of trabecular bone rather than in their normal parasinusoidal site concomitant with an increased stromal-derived factor-1 level. A subsequent increase in 2 megakaryocyte-derived growth factors, platelet-derived growth factor-beta and basic fibroblast growth factor, induces a 2-fold expansion of the population of N-cadherin-/osteopontin-positive osteoblasts, relative to the homeostatic osteoblast population, and hence, increases the number of potential niches for HSC engraftment. After donor cell engraftment, this expanded microenvironment reverts to its homeostatic state. Our results demonstrate the rapid recovery of osteoblastic stem cell niches after marrow radioablation, provide critical insights into the associated mechanisms, and suggest novel means to manipulate the bone marrow microenvironment to promote HSC engraftment.
Figures
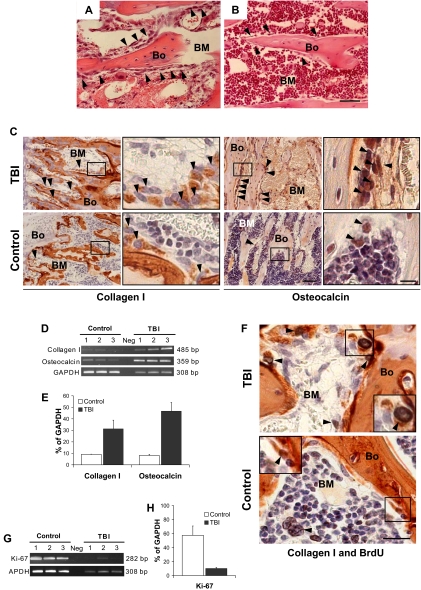
 ) compared with (B) the nonirradiated control (hematoxylin-and-eosin stain). (A,B) Scale bar represents 50 μm. (C) Immunohistochemical staining (in red) to identify the bone-lining cells in panels A and B revealed an increase of collagen I (left) and osteocalcin (right) producing osteoblasts (). Scale bar (third column) represents 50 μm; scale bar (fourth column) represents 10 μm. (D) Semiquantitative RT-PCR analysis confirming an increased expression of collagen I and osteocalcin in TBI mice. The negative control (Neg, without template) is shown in the middle lane. (E) Comparison of transcript band intensities, for genes encoding collagen I and osteocalcin, expressed in irradiated and nonirradiated mice. The values were calculated relative to GAPDH levels and reported as mean percentages (± SD) of 6 mice per group. Both collagen I (P = .01) and osteocalcin (P = .001) levels are significantly increased over control values (Student t test). (F) Double staining of sections from TBI and control mice with anti-BrdU (black) and anticollagen I (red) antibodies. The typical nuclear pattern of the BrdU labeling and the simultaneous collagen I expression () demonstrates the presence of proliferating osteoblasts after TBI. The BrdU-positive cells in the control mice are predominantly present in the BM space (), with rare double-positive osteoblasts (inset). Scale bar represents 20 μm. (G) Semiquantitative RT-PCR analysis of Ki-67 expression by marrow cells from TBI and control mice demonstrates the persistence of proliferating BM cells after irradiation. (H) Comparison of transcript band intensities for Ki-67 expressed in irradiated versus nonirradiated mice. Values were calculated relative to GAPDH levels and reported as mean percentages (± SD) of 6 mice per group. Ki-67 expression was significantly decreased (P < .01) but persisted in irradiated mice.
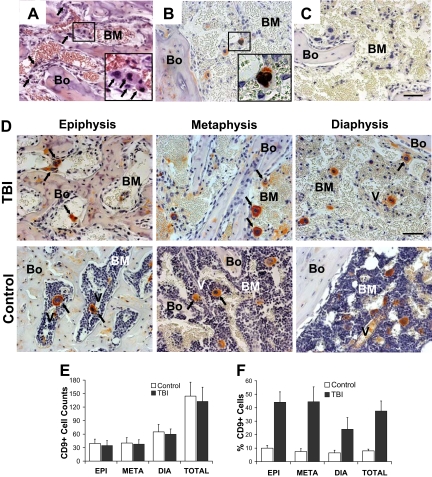
 ) with large multilobulated nuclei that appear as megakaryocytes (inset). (B) Immunohistochemical staining with anti-CD9 (red) and anti-BrdU (black) antibodies confirms the presence of physiologically active megakaryocytes after TBI. The inset represents an enlarged image of the results of CD9 and BrdU double staining. (C) Bone section stained with isotype control primary antibody. (D) Specific pattern of megakaryocyte distribution in response to TBI as revealed by staining for CD9 (red). After radioablation, megakaryocytes () can be found in close contact with the bone-lining cells, whereas in the control they are located primarily in the central areas of the BM, often in close proximity to the vessels (V). (A-D) Scale bar represents 50 μm. (E) Total CD9+ multilobulated megakaryocyte counts in the epiphysis, metaphysis, diaphysis, and total marrow space of control versus irradiated mice (n = 4). Mean (± SD) values for randomly selected 200× fields (288 sections scored for each group) are shown. Differences between the control and irradiated groups are not significant (P > .05). (F) Mean percentages (± SD) of CD9+ multilobulated megakaryocytes in contact with the cells lining the bone in control versus irradiated mice (n = 4). Percentages of bone-associated megakaryocytes were significantly higher in irradiated mice in all 3 major bone regions (P ≤ .01), with the epiphysis and metaphysis both showing greater accumulations of megakaryocytes at the bone surface than was apparent in the diaphysis (P < .001).
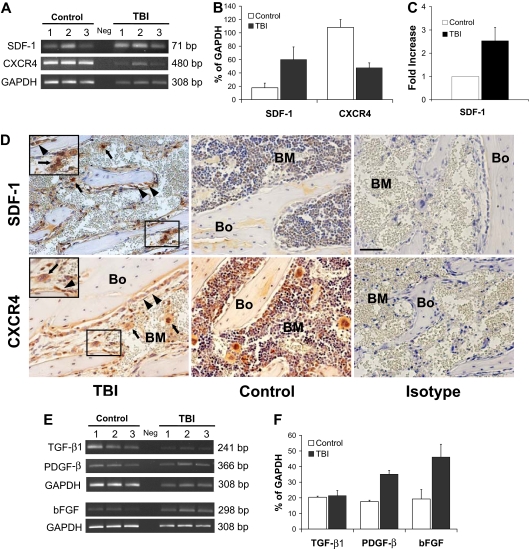 , left panel) and megakaryocytes () after 48 hours after TBI vs nonirradiated control mice (middle panel). Bone (Bo) from a TBI mouse stained using an isotype primary antibody was used as control (right panel). (Bottom) In contrast to SDF-1, the CXCR4 levels decreased at 48 hours after TBI and remained localized into the osteoblasts () and in the surviving megakaryocytes (). Controls and isotype-stained sections as described for SDF-1. Scale bar represents 50 μm. (E) Semiquantitative RT-PCR analyses of TGF-β1, PGDF-β, and bFGF in BM cells flushed from mice in the TBI and nonirradiated control groups (n = 3). The negative control (Neg, without template) is shown in the middle lane. (F) Levels of PGDF-β and bFGF, but not TGF-β1, calculated relative to GAPDH levels and reported as mean percentages (± SD), were significantly higher in the TBI group (P = .006, P = .02, P > .05, respectively).
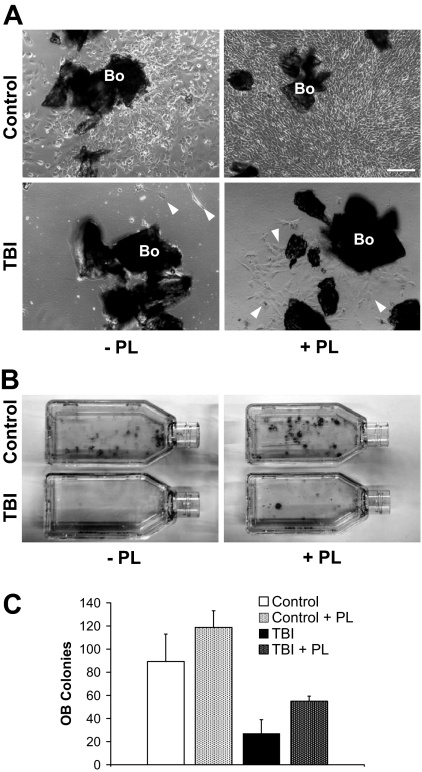 ) from marrow microenvironment is followed by a defective in vitro behavior. The addition of PL (+PL, right) increased the proliferation of osteoblasts from controls (top right) as well as from the irradiated animals (bottom right). Osteoblasts are indicated (). Scale bar represents 200 μm. (B) Representative pictures of osteoblast colonies from irradiated or control mice, after 2 weeks in culture with or without PL. (C) In vitro osteoblast colony count (per 200 mg processed bone chips) from irradiated and control mice, with or without PL. A reduction of the average colony number is observed after irradiation (89.2 ± 23.7 vs 27 ± 12, P = .006), indicating a damage that is not restored because of the absence of megakaryocyte-derived growth factors in the cultures. PL was able to significantly increase the colony number both in control samples (89.2 ± 23.7 vs 118.7 ± 14.4, P = .04) and after TBI (27 ± 12 vs 55 ± 4.3, P = .03). Experiments were performed at least in triplicate.
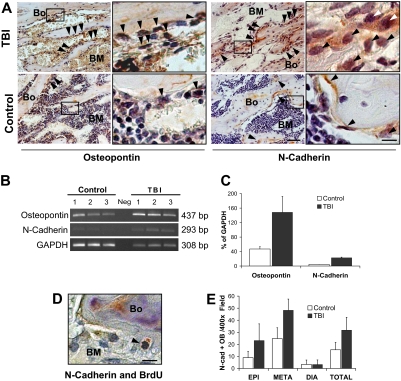 ). Scale bar (third column) represents 50 μm; scale bar (fourth column) represents 10 μm. (B) Semiquantitative RT-PCR analysis showing increased expression of osteopontin and N-cadherin in the TBI group. The negative control (Neg, without template) is shown in the middle lane. (C) Comparison of osteopontin and N-cadherin expression levels in irradiated versus nonirradiated control mice. Transcript band intensities are calculated in relation with the GAPDH levels and reported as mean percentages (± SD) of 6 measurements per group. Significant increases of osteopontin and N-cadherin are detected after irradiation (P = .03 and P < .001, respectively). (D) Double staining of TBI mice with anti-BrdU (black) and anti–N-cadherin (red) antibodies. Scale bar represents 20 μm. The typical nuclear pattern of the BrdU labeling and simultaneous N-cadherin expression () demonstrates the presence of proliferating N-cadherin–positive osteoblasts after TBI. (E) N-cadherin–positive osteoblasts (OB) in the epiphysis, metaphysis, diaphysis, and total marrow space at 48 hours after irradiation. Mean (± SD) numbers of cells per 400× microscopic field (n = 420 fields/group) are shown.
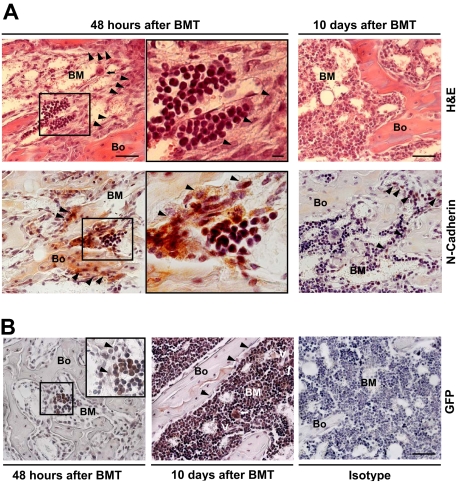 ) and the persistence of megakaryocytes in their proximity (
 ; top left panel) are apparent at 48 hours after BMT. The engrafted cells appear as discrete clusters of small round cells close to the endosteum (center panels are the insets indicated in left panels). Scale bar (left and right panels) represents 50 μm; scale bar (center panels) represents 10 μm. (B) Sections obtained 48 hours (left) or 10 days (center) after donor (GFP+) BMT immunostained for GFP. The previously observed cells appear as donor derived clusters (≤ 6/femur) located in the metaphysis and epiphysis of recipients. At 10 days after transplantation, the marrow cellularity increased (center), megakaryocytes (⇑) were frequently found close to vessels (V) and bone lining cells returned to a single tier (). Isotype control is shown for comparison (right). Scale bar: 50 μm.
Comment in
-
The osteoblastic niche following TBI.Blood. 2009 Sep 10;114(11):2210-1. doi: 10.1182/blood-2009-06-223487. Blood. 2009. PMID: 19745074 No abstract available.
-
Restoration of the human stem cell niche after stem cell transplantation.Blood. 2009 Dec 17;114(26):5404-6; author reply 5406-7. doi: 10.1182/blood-2009-08-240176. Blood. 2009. PMID: 20018929 No abstract available.
References
-
- Nilsson SK, Johnston HM, Whitty GA, et al. Osteopontin, a key component of the hematopoietic stem cell niche and regulator of primitive hematopoietic progenitor cells. Blood. 2005;106:1232–1239. - PubMed
-
- Zhang J, Niu C, Ye L, et al. Identification of the haematopoietic stem cell niche and control of the niche size. Nature. 2003;425:836–841. - PubMed
-
- Hosokawa K, Arai F, Yoshihara H, et al. Function of oxidative stress in the regulation of hematopoietic stem cell-niche interaction. Biochem Biophys Res Commun. 2007;363:578–583. - PubMed
Publication types
MeSH terms
Substances
Grants and funding
LinkOut - more resources
Full Text Sources
Other Literature Sources
Medical
Molecular Biology Databases
Research Materials
