Review
. 2009 Jun;10(6):392-404.
doi: 10.1038/nrg2579.

Detecting gene-gene interactions that underlie human diseases

Affiliations
Review

Detecting gene-gene interactions that underlie human diseases

Heather J Cordell. Nat Rev Genet. 2009 Jun.

Abstract

Following the identification of several disease-associated polymorphisms by genome-wide association (GWA) analysis, interest is now focusing on the detection of effects that, owing to their interaction with other genetic or environmental factors, might not be identified by using standard single-locus tests. In addition to increasing the power to detect associations, it is hoped that detecting interactions between loci will allow us to elucidate the biological and biochemical pathways that underpin disease. Here I provide a critical survey of the methods and related software packages currently used to detect the interactions between genetic loci that contribute to human genetic disease. I also discuss the difficulties in determining the biological relevance of statistical interactions.


Figures

Box 2 Figure
Box 2 Figure
Figure 1
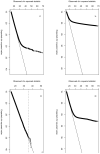
Figure 1. Semi-exhaustive search of pairwise interactions between 89294 SNPs
I used the --fast-epistasis and --case-only options in PLINK to analyse the WTCCC Crohn's disease and control samples. I used the same quality control procedures as the WTCCC to remove poor-quality SNPs and samples prior to analysis. I additionally discarded 561 SNPs that had been analysed by WTCCC but were subsequently discarded based on visual inspection of the SNP intensity cluster plots (Jeff Barrett, personal communication). To reduce the number of interaction tests to be performed I selected a set of 89294 SNPs that passed a single-locus p value threshold of 0.2. Analysis of the 89294 SNPs on a single node of a computer cluster took 14 days. Unfortunately, neither SNP in the interaction detected by Emily et al. had the opportunity to appear in my analysis, as neither had a single-locus p value <=0.2. (A) Results from --case-only analysis, in which SNP pairs were discarded if they were < 1Mb apart (Panel a), <5Mb apart (Panel b), and <50Mb apart (Panel c). The default in PLINK is to exclude tests of pairs of SNPs that are less than 1Mb apart. Even when extreme separations of 5Mb or 50Mb are enforced (Panels b and c), we find an excessive number of apparently significant results. Closer inspection revealed that in many cases these significant results result from correlation (within the sample of cases) between alleles at loci on different chromosomes. Given the general departure from the expected distribution, it seems likely that these significant --case-only results are artifacts rather than genuine interaction effects. Panel d: Q-Q plot of all results from the --fast-epistasis with p value < 0.0001. These results lie much closer to the expected line: indeed only one result appears to show strong departure from expected significance. The top ranking results (those with χ2 > 35, as indicated by the dashed line on Panel d) are shown in Supplementary Table 1. Interestingly, most of the SNPs involved in the putative interactions show little single-locus significance, apart from rs4471699 on chromosome 16. This SNP was not reported as significantly associated by WTCCC . (B) Single-locus association results across chromosome 16. rs4471699 at position 30227808 shows the highest significance, but is far removed from the bulk of the significant results which are situated close to the NOD2/CARD15 gene (around position 49297083) Further investigation revealed that this SNP had been excluded from the WTCCC analysis owing to poor genotype clustering (Jeff Barrett, personal communication), even though it passed the stated WTCCC exclusion criteria and had not appeared in the original list of additional exclusions I was given. It therefore seems highly likely that both the single-locus and interaction results at rs447169 represent false positives.
Figure 2
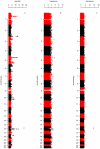
Figure 2. Random Jungle Analysis of 89294 SNPs
I used the software package Random Jungle to perform a random forests analysis of the 89294 SNPs passing a single-locus p value threshold of 0.2 in the WTCCC Crohn's and control data. Since Random Jungle, in common with many other machine-learning approaches, prefers not to have missing (incomplete) genotype data, missing genotypes were imputed as the single most likely value on the basis of the genotype frequencies in the case-control data set. Analysis of the 89294 SNP set took approximately 5 hours, using 6000 trees in the forest and n=89294 randomly chosen variables at each node. Panel A: Importance values from random jungle analysis. These are clearly dominated by the (likely false positive) result at rs4471699 on chromosome 16. Panel B: Results from random jungle analysis with SNP rs4471699 removed. Once this SNP is removed, the remaining SNPs are better distinquished, but it is unclear whether this analysis offers any greater insight than the single-locus analysis. Panel C: Results from single-locus association analysis of all 6113 SNPs using the trend test implemented in PLINK. In many cases the highest ranking SNPs appear in similar locations to Panel B, but with clearer significance in Panel C.
Figure 3
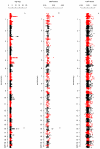
Figure 3. MDR and TuRF analysis of 6113 SNPs
I used the Java implementation of MDR to analyse 6113 SNPs passing a single-locus p value threshold of 0.01 in the WTCCC Crohn's and control data, with missing (incomplete) genotypes imputed as described in the legend to Figure 2. Examination of all pairwise combinations in the entire 6113 SNP set proved computationally prohibitive but analysis via use of a prior filtering step with ReliefF or TuRF, which reduced the data set for MDR analysis to 1000 SNPs, was achievable. The best single-locus model identified was rs4471699, providing testing accuracy of 0.5852 and cross validation consistency of 10/10. The best two-locus model identified was rs4471699 and rs2076756, providing testing accuracy of 0.5879 and cross validation consistency of 4/10. MDR, in common with the other methods investigated, has clearly been dominated by the false positive result at rs4471699. Interestingly, however, this SNP is not selected by TuRF when filtering down the set of SNPs for MDR analysis to include only 100 SNPs. With the 100 SNP set, the best single-locus model identified was rs931058, providing testing accuracy of 0.5114 and cross validation consistency of 5/10. The best two-locus model identified was rs931058 and rs10824773, providing testing accuracy of 0.5205 but cross validation consistency of only 2/10. With the 100 SNP set it was computationally feasible to fit 3-locus and 4-locus models, however the resulting best models had similarly low cross validation consistencies. I also found extreme sensitivity (in both TuRF and MDR) to the choice of random number seed (data not shown), suggesting that, overall, these results should be interpreted with caution. A problem with MDR is that it outputs only the ‘best’ model rather than a measure of significance for all models or variables considered. Some idea of the ‘importance’ of variables can be determined by examining the ‘fitness landscape’ output from the program, shown here. Panel A: Fitness landscape scores from TuRF analysis of all 6113 SNPs Panel B: Fitness landscape scores from MDR analysis using top 1000 out of 6113 SNPs (filtered using TuRF) Panel C: Results from single-locus association analysis of all 6113 SNPs using the trend test implemented in PLINK. It is unclear whether the fitness landscape results from TuRF (Panel A) or MDR (Panel B) offer any great advantage over standard single-locus analysis (Panel C) with respect to determining the importance of variables.
Figure 4
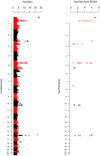
Figure 4. BEAM analysis of 47727 SNPs
I used BEAM to analyse a set of 47724 SNPs passing a single-locus p value threshold of 0.1 in the WTCCC Crohn's and control samples. Analaysis of the 47724 SNPs took 8 days (with some modification to the default settings, most notably imposing a maximum of 5 × 10⁷ MCMC iterations as opposed to the default value of n2, where n is the number of loci). I estimated that analysis of the 89294 SNP set (passing a single-locus p value threshold of 0.2) with a similar number of MCMC iterations would have taken more than five weeks. Panel A: ‘B-statistic’ p values for the 1321 single-locus associations detected by BEAM. Panel B: Results from single-locus association analysis of all 47727 SNPs using the trend test implemented in PLINK. BEAM detects essentially the same loci as are detected by single-locus analysis. BEAM additionally detects (with quoted p = 0.000000) four two-locus interactions, each involving an interaction of rs2532292 on chromosome 17 with a nearby SNP (either rs12150547, rs17689882, rs17650381 or rs17574824) within the same cluster. None of these SNPs shows particularly strong single-locus association and so this putative interaction is intriguing. However, none of these pairs of SNPs showed significant (defined as p value < 0.0001) interaction in the PLINK --fast-epistasis analysis. Closer inspection of these SNPs in the control sample indicated that they are in strong LD (D′ > 0.99) with one another, suggesting that the detected interactions may in fact correspond to marker dependencies due to LD, rather than to genuine interaction effects.

Comment in

Similar articles

Cited by

References

    1. WTCCC Genome-wide association study of 14,000 cases of seven common diseases and 3,000 shared controls. Nature. 2007;447:661–678. - PMC - PubMed
    1. Easton DF, Pooley KA, Dunning AM, Pharoah PD, Thompson D, Ballinger DG, Struewing JP, Morrison J, Field H, Luben R, et al. Genome-wide association study identifies novel breast cancer susceptibility loci. Nature. 2007;447:1087–1093. - PMC - PubMed
    1. Frayling TM, Timpson NJ, Weedon MN, Zeggini E, Freathy RM, Lindgren CM, Perry JR, Elliott KS, Lango H, Rayner NW, et al. A common variant in the FTO gene is associated with body mass index and predisposes to childhood and adult obesity. Science. 2007;316:889–894. - PMC - PubMed
    1. Plenge RM, Seielstad M, Padyukov L, Lee AT, Remmers EF, Ding B, Liew A, Khalili H, Chandrasekaran A, Davies LR, et al. TRAF1-C5 as a risk locus for rheumatoid arthritis–a genomewide study. The New England Journal of Medicine. 2007;357:1199–1209. - PMC - PubMed
    1. Fellay J, Shianna KV, Ge D, Colombo S, Ledergerber B, Weale M, Zhang K, Gumbs C, Castagna A, Cossarizza A, et al. A whole-genome association study of major determinants for host control of HIV-1. Science. 2007;317:944–947. - PMC - PubMed

Publication types

MeSH terms