. 2009 Apr 27:3:6.
doi: 10.3389/neuro.09.006.2009. eCollection 2009.

Spatial selection of features within perceived and remembered objects

Affiliations

Spatial selection of features within perceived and remembered objects

Duncan E Astle et al. Front Hum Neurosci. .

Abstract

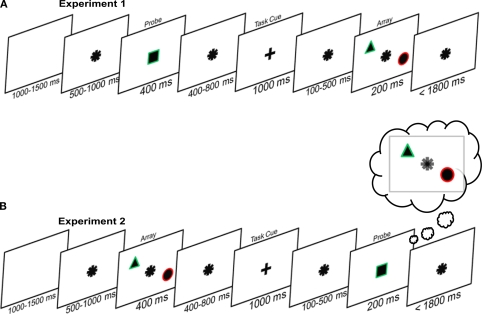
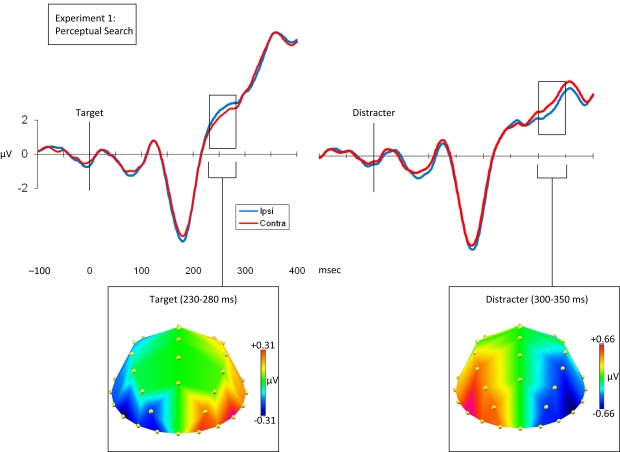
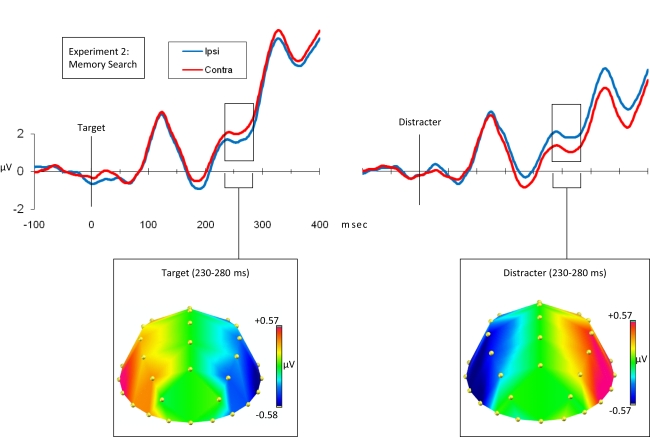
Our representation of the visual world can be modulated by spatially specific attentional biases that depend flexibly on task goals. We compared searching for task-relevant features in perceived versus remembered objects. When searching perceptual input, selected task-relevant and suppressed task-irrelevant features elicited contrasting spatiotopic ERP effects, despite them being perceptually identical. This was also true when participants searched a memory array, suggesting that memory had retained the spatial organization of the original perceptual input and that this representation could be modulated in a spatially specific fashion. However, task-relevant selection and task-irrelevant suppression effects were of the opposite polarity when searching remembered compared to perceived objects. We suggest that this surprising result stems from the nature of feature- and object-based representations when stored in visual short-term memory. When stored, features are integrated into objects, meaning that the spatially specific selection mechanisms must operate upon objects rather than specific feature-level representations.

Keywords: ERPs; electrophysiology; spatial attention; task-set control; visual short-term memory; working memory.


Figures

Figure 1
Figure 1
The experimental paradigm. (A) Perceptual search: participants first saw a probe stimulus and then a task cue instructing them on whether the color or shape of that probe was relevant for the upcoming search. Finally, an array of two shapes appeared and participants had respond as to whether the relevant probe feature was present in the array. (B) Memory search: participants first saw the array of two objects, and were subsequently instructed as to whether color or shape was relevant on that trial. Finally participants were presented with the probe, and had to decide whether the memory array contained the relevant feature of the probe. In both cases the actual display consisted of white figures (shapes and cues) on a black background. In both cases participants responded with their right hand, using the index finger for ‘target-present’ and the middle finger for ‘target-absent’.
Figure 2
Figure 2
Grand average waveforms time-locked to the array onset at 0 ms. The left-hand figure shows target-locked waveforms, and the right-hand figure shows distracter-locked waveforms. In both cases the blue waveform indicates the average voltage (μV) recording from electrodes ipsilateral to the matching feature, and the red waveform indicates the average voltage (μV) recording from electrodes contralateral to the matching figure. In both cases the waveforms indicate the mean of the PO3/4, PO7/8, O1/2 and P7/8 recordings. Bellow each waveform is a topographical plot. Both plots show the distribution of the contralateral minus ipsilateral difference, with the left-hemisphere showing contralateral minus ipsilateral and the right-hemisphere being the mirror of this (ipsilateral minus contralateral). This is shown for the targets from 230 to 280 ms, and for the distracters from 300 to 350 ms.
Figure 3
Figure 3
Grand average waveforms time-locked to the probe onset at 0 ms. The left-hand figure shows target-locked waveforms and the right-hand figure shows distracter-locked waveforms. In both cases the blue waveform indicates the average voltage (μV) from electrodes ipsilateral to the matching figure, and the red waveform indicates the average voltage (μV) from electrodes contralateral to the matching feature. Importantly, in the memory task ipsilateral and contralateral are defined on the basis of the original array, because the probe (to which the waveforms are time-locked) is centrally presented. In both cases the waveforms indicate the mean of the P7/8, P3/4, PO7/8 and TP7/8 recordings. Below each waveform is a topographical plot. Both plots show the distribution of the contralateral–ipsilateral difference, with the left-hemisphere showing contralateral minus ipsilateral and the right-hemisphere being the mirror of this (ipsilateral minus contralateral). This is shown for the targets and distracters from 230 to 280 ms.

References

    1. Astle D. E., Jackson G. M., Swainson R. (2008). Fractionating the cognitive control required to bring about a change in task-set: a dense-sensor ERP study. J. Cogn. Neurosci. 20, 255–26710.1162/jocn.2008.20015 - DOI - PubMed
    1. Awh E., Barton B., Vogel E. K. (2007). Visual working memory represents a fixed number of items regardless of complexity. Psychol. Sci. 18, 622–62810.1111/j.1467-9280.2007.01949.x - DOI - PubMed
    1. Chelazzi L., Miller E. K., Duncan J., Desimone R. (1993). A neural basis for visual search in inferior temporal cortex. Nature 363, 345–34710.1038/363345a0 - DOI - PubMed
    1. Dell'Acqua R., Sessa P., Jolicoeur P., Robitaille N. (2006). Spatial attention freezes during the attention blink. Psychophysiology 43, 394–40010.1111/j.1469-8986.2006.00411.x - DOI - PubMed
    1. Desimone R., Duncan J. (1995). Neural mechanisms of selective visual attention. Annu. Rev. Neurosci. 18, 193–22210.1146/annurev.ne.18.030195.001205 - DOI - PubMed

LinkOut - more resources