Comparative Study
. 2009 May 12:10:221.
doi: 10.1186/1471-2164-10-221.

Measuring differential gene expression by short read sequencing: quantitative comparison to 2-channel gene expression microarrays

Affiliations
Comparative Study

Measuring differential gene expression by short read sequencing: quantitative comparison to 2-channel gene expression microarrays

Joshua S Bloom et al. BMC Genomics. .

Abstract

Background: High-throughput cDNA synthesis and sequencing of poly(A)-enriched RNA is rapidly emerging as a technology competing to replace microarrays as a quantitative platform for measuring gene expression.

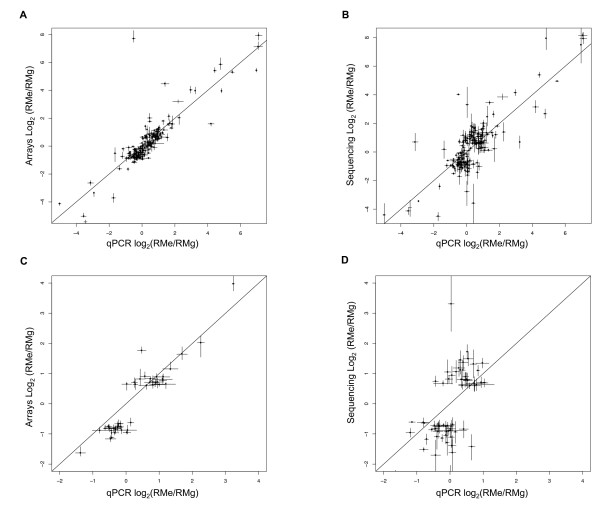
Results: Consequently, we compared full length cDNA sequencing to 2-channel gene expression microarrays in the context of measuring differential gene expression. Because of its comparable cost to a gene expression microarray, our study focused on the data obtainable from a single lane of an Illumina 1 G sequencer. We compared sequencing data to a highly replicated microarray experiment profiling two divergent strains of S. cerevisiae.

Conclusion: Using a large number of quantitative PCR (qPCR) assays, more than previous studies, we found that neither technology is decisively better at measuring differential gene expression. Further, we report sequencing results from a diploid hybrid of two strains of S. cerevisiae that indicate full length cDNA sequencing can discover heterozygosity and measure quantitative allele-specific expression simultaneously.


Figures

Figure 1
Figure 1
Sequencing and arrays show correlated differential expression but sequencing is more susceptible to sampling error. Read counts are not evenly distributed across genes. For the RMg sample, log10 read counts per gene are shown (A), with genes ordered by abundance. The log2 ratio of the medians of six replicate microarray experiments for RM in ethanol vs RM in glucose is compared to the log2 ratio of sequencing read counts. The methods are correlated (R = 0.75356, 95% CI: 0.7236–0.785). Colors indicate significantly differentially expressed genes at a FDR<1% and 1.5 fold or greater change, where significance is determined using Fisher's exact test for the sequencing data and the Mann-Whitney test for the array data. Purple indicates significantly different by both methods, green is significantly different by sequencing only, blue is significantly different by microarrays only, and red is significant by both methods but with opposite directionality (B). Data from (B) but represented as a Venn diagram of significant differences; note in red the 9 genes measured as significantly changed but in opposite directions (C). The results from (B) can be modeled by sampling from binomial distributions for each gene. Here a single random sampling is shown (D). The correlation of log2 expression ratios determined by microarrays and sequencing is highly dependent on the number of read counts per gene. For both the actual data (black), and simulated data (green) with 95% confidence intervals (light green), correlation improves as the thresholds for sequence coverage increase (E).
Figure 2
Figure 2
Quantitative PCR of significantly differentially expressed genes show better agreement with arrays than sequencing. 192 randomly sampled significantly differently expressed genes were analyzed by qPCR. qPCR results are highly correlated with both microarrays (R = 0.86, bootstrap 95% CI: 0.7043 – 0.953) (A) and sequencing results (R = .82, bootstrap 95% CI: 0.7031 – 0.8917) (B). However, the subset of the tested genes that were called significantly differentially expressed by the arrays only (see Fig. 1A, red dots) were more highly correlated (R = 0.925, bootstrap 95% CI: 0.8621 – 0.9648) (C) than the subset of genes that were called significant by sequencing (see Fig. 1A, green) (R = 0.518, bootstrap 95% CI: 0.3227 – 0.7069) (D). Error bars represent 95% confidence intervals for the differential expression measurements.

Similar articles

Cited by

References

    1. Marioni JC, Mason CE, Mane SM, Stephens M, Gilad Y. RNA-seq: An assessment of technical reproducibility and comparison with gene expression arrays. Genome Res. 2008;18:1509–1517. doi: 10.1101/gr.079558.108. - DOI - PMC - PubMed
    1. Nagalakshmi U, Wang Z, Waern K, Shou C, Raha D, Gerstein M, Snyder M. The transcriptional landscape of the yeast genome defined by RNA sequencing. Science. 2008;320:1344–1349. doi: 10.1126/science.1158441. - DOI - PMC - PubMed
    1. Lister R, O'Malley RC, Tonti-Filippini J, Gregory BD, Berry CC, Millar AH, Ecker JR. Highly integrated single-base resolution maps of the epigenome in Arabidopsis. Cell. 2008;133:523–536. doi: 10.1016/j.cell.2008.03.029. - DOI - PMC - PubMed
    1. Torres TT, Metta M, Ottenwalder B, Schlotterer C. Gene expression profiling by massively parallel sequencing. Genome Res. 2008;18:172–177. doi: 10.1101/gr.6984908. - DOI - PMC - PubMed
    1. Mortazavi A, Williams BA, McCue K, Schaeffer L, Wold B. Mapping and quantifying mammalian transcriptomes by RNA-Seq. Nat Methods. 2008;5:621–628. doi: 10.1038/nmeth.1226. - DOI - PubMed

Publication types

MeSH terms