. 2009 May 12:9:56.
doi: 10.1186/1471-2229-9-56.

Development-dependent changes in the tight DNA-protein complexes of barley on chromosome and gene level

Affiliations

Development-dependent changes in the tight DNA-protein complexes of barley on chromosome and gene level

Tatjana Sjakste et al. BMC Plant Biol. .

Abstract

Background: The tightly bound to DNA proteins (TBPs) is a protein group that remains attached to DNA with covalent or non-covalent bonds after its deproteinisation. The functional role of this group is as yet not completely understood. The main goal of this study was to evaluate tissue specific changes in the TBP distribution in barley genes and chromosomes in different phases of shoot and seed development. We have: 1. investigated the TBP distribution along Amy32b and Bmy1 genes encoding low pI alpha-amylase A and endosperm specific beta-amylase correspondingly using oligonucleotide DNA arrays; 2. characterized the polypeptide spectrum of TBP and proteins with affinity to TBP-associated DNA; 3. localized the distribution of DNA complexes with TBP (TBP-DNA) on barley 1H and 7H chromosomes using mapped markers; 4. compared the chromosomal distribution of TBP-DNA complexes to the distribution of the nuclear matrix attachment sites.

Results: In the Amy32b gene transition from watery ripe to the milky ripeness stage of seed development was followed by the decrease of TBP binding along the whole gene, especially in the promoter region and intron II. Expression of the Bmy1 gene coupled to ripening was followed by release of the exon III and intron III sequences from complexes with TBPs. Marker analysis revealed changes in the association of chromosome 1H and 7H sites with TBPs between first leaf and coleoptile and at Zadoks 07 and Zadoks 10 stages of barley shoot development. Tight DNA-protein complexes of the nuclear matrix and those detected by NPC-chromatography were revealed as also involved in tissue- and development-dependent transitions, however, in sites different from TBP-DNA interactions. The spectrum of TBPs appeared to be organ and developmental-stage specific. Development of the first leaf and root system (from Zadoks 07 to Zadoks 10 stage) was shown as followed by a drastic increase in the TBP number in contrast to coleoptile, where the TBPs spectrum became poor during senescence. It was demonstrated that a nuclear protein of low molecular weight similar to the described TBPs possessed a high affinity to the DNA involved in TBP-DNA complexes.

Conclusion: Plant development is followed by redistribution of TBP along individual genes and chromosomes.


Figures

Figure 1
Figure 1
Amy32b (lanes 1, 2), Bmy1 (lane 3, 4) and alpha tubulin (lanes 1 – 4) RT-PCR products. Lanes 1, 3 – RNA from watery ripe seeds; lanes 2, 4 – RNA from milky ripe barley seeds. Positions of the molecular weight markers (bp) are indicated on the right. Positions of RT-PCR products are indicated on both sides of the figure.
Figure 2
Figure 2
DNA array based mapping of the TBPs distribution in Amy32b structural gene in watery ripe (A) and milky ripe (B) barley seeds. Upper panel presents the gene structure with positions of oligonucleotides of the array and regions of the similarity with Bmy1 (S1 – S13). Star indicates position of the TATA box, black arrow in last exon indicates stop codon. Exon numbers are given as Roman numerals. The data in lower panels represent the ratio of hybridization of R vs F DNA fractions scored as an average of three independent experiments (two hybridizations per experiment). Error bars represent standard deviation.
Figure 3
Figure 3
DNA array based mapping of the TBPs distribution in Bmy1 structural gene in watery ripe (A) and milky ripe (B) barley seeds. Upper panel presents the gene structure with positions of oligonucleotides of the array and regions of similarity with Amy32b gene (S1 – S13). Stars correspond to the positions of the TATA boxes; black arrow in last exon VII indicates the stop codon. Exon numbers are given in Roman numerals. Black and dashed squares in the Intron III indicate the positions of the microsatellite and MITE element, correspondingly. The predicted MAR position is indicated by a checked bar. The data on lower panels represent the ratio of hybridization of R vs F DNA fractions scored as an average of three independent experiments (two hybridizations per experiment). Error bars represent standard deviation.
Figure 4
Figure 4
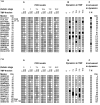
The distribution of microsatellite sequences in free DNA and tight DNA-protein complexes along barley chromosomes 1H and 7H. A. The distribution of DNA fragments containing given microsatellites in free DNA (F), and tight DNA-protein complexes (R1 and R2). Marker names are given in the left column, following column gives distance from the chromosome extremity in centimorganides. Position of the centromere is indicated separately (Cen). 0 – dry seeds (phase 0), 1 – 20 hours of imbibition (phase 01); 7-L – first leaf on stage 07; 10-L – leaf on stage 10; 7-C – coleoptile on stage 07; 10-C – coleoptile on stage 10. Grey squares – presence of amplification; white squares – absence of amplification. B. Summary of the trends of transitions during development of different organs compared with the situation in dry seed. Grey squares – situation in the seed or similar; white squares – decrease of association with TBPs; black squares – increase in TBP-DNA interactions. C. General summary of involvement of the studied genomic sites in R-F and adverse transitions. Black points on white background – site involved in transitions; white points on black background – site not involved in transitions.
Figure 5
Figure 5
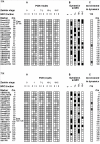
The distribution of microsatellite sequences in chromatin fractions and nuclear matrix-attached DNA along barley chromosomes 1H and 7H. Columns in the right part of the figure illustrate the distribution of DNA fragments containing given microsatellites in fractions of soluble chromatin (SC), insoluble chromatin (IC) and the nuclear matrix (NM). Panel on the right indicates involvement in association or dissociation of the nuclear matrix. Grey and white squares correspond to the presence and absence of amplification correspondingly. Black points on white background and white points on black background indicate on the sites involved and not involved in transitions. All other designations are as in Figure 4.
Figure 6
Figure 6
The distribution of microsatellite sequences in fractions obtained in the course of chromatography of nucleoproteins on celite. A. The distribution of DNA fragments containing given microsatellites in unbound to nuclear matrix fraction (eluted in NaCl gradient, DNA 0, column 0 on the Figure), loosely bound to the nuclear matrix (eluted in LiCl-urea gradient and in temperature gradient below 70°C, DNA I (column I) and tightly bound to the nuclear matrix (eluted in temperature gradient at 90°C, DNA II, column II). Grey and white squares indicate presence and absence of amplification correspondingly. All other designations are like in Figure 4. B. Summary of the trends of transitions during development of different organs compared with the situation in dry seed. Grey squares – situation in the seed or similar; white squares – loosening of association with the nuclear matrix; black squares -tightening of interactions. C. General summary of involvement of the studied genomic sites in association-dissociation according the NPC chromatography data. Black points on white background – sites involved in transitions; white points on black background – sites not involved in transitions.
Figure 7
Figure 7
Electropherograms of the tightly bound proteins obtained by DNase I digestion of bulk DNA of leaves (L), roots (R) and coleoptiles (C) of stage 07 and stage 10 barley shoots. Arrows indicate positions of molecular weight markers (KDa). 10% PAAG. Silver staining.
Figure 8
Figure 8
DNA-binding protein blot assay. Assay was performed with electrophoretically fractionated nuclear proteins isolated from the Zadoks 07 (1 – 3) and Zadoks 10 (4 – 6) coleoptiles (1, 4), leaves (2, 5), and roots (3, 6) and incubated with TBP-associated DNA from Zadoks 10 leaves.

Similar articles

Cited by

References

    1. Steinmüller K, Batschauer A, Apel K. Tissue-specific and light-dependent changes of chromatin organization in barley (Hordeum vulgare) Eur J Biochem. 1986;158:519–525. doi: 10.1111/j.1432-1033.1986.tb09785.x. - DOI - PubMed
    1. Tsanev R, Avramova Z. Stably-bound chromosomal proteins. Chromosoma. 1994;103:293–301. doi: 10.1007/BF00417876. - DOI - PubMed
    1. Pfütz M, Gileadi O, Werner D. Identification of human satellite DNA sequences associated with chemically resistant nonhistone polypeptide adducts. Chromosoma. 1992;101:607–617. doi: 10.1007/BF00360538. - DOI - PubMed
    1. Werner D, Neuer-Nitsche B. Site-specific location of covalent DNA-polypeptide complexes in the chicken genome. Nucleic Acids Res. 1989;17:6005–6015. doi: 10.1093/nar/17.15.6005. - DOI - PMC - PubMed
    1. Neuer-Nitsche B, Lu X, Werner D. Functional role of a highly repetitive DNA sequences to anchorage of the mouse genome. Nucleic Acids Res. 1988;16:8351–8360. doi: 10.1093/nar/16.17.8351. - DOI - PMC - PubMed

Publication types

MeSH terms