

Effects of pain- and analgesia-related manipulations on intracranial self-stimulation in rats: further studies on pain-depressed behavior
- PMID: 19435650
- PMCID: PMC2717894
- DOI: 10.1016/j.pain.2009.04.010
Effects of pain- and analgesia-related manipulations on intracranial self-stimulation in rats: further studies on pain-depressed behavior
Abstract
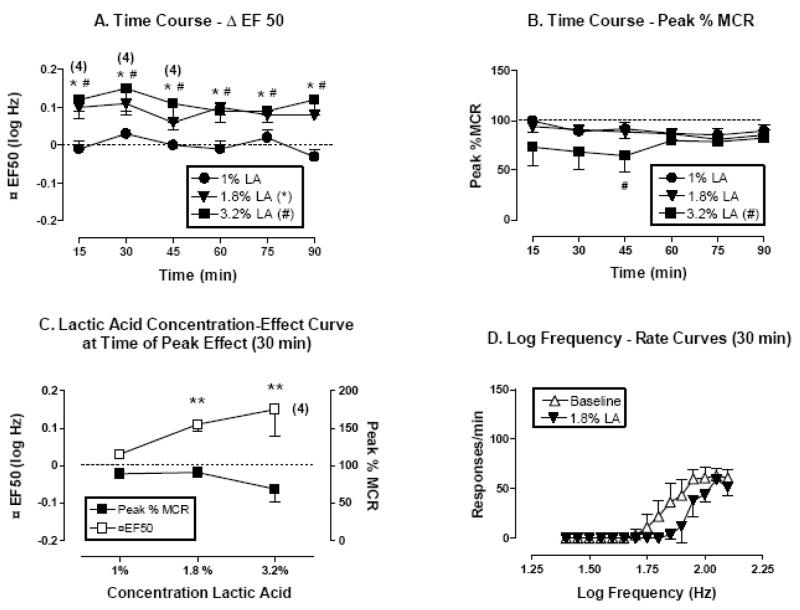
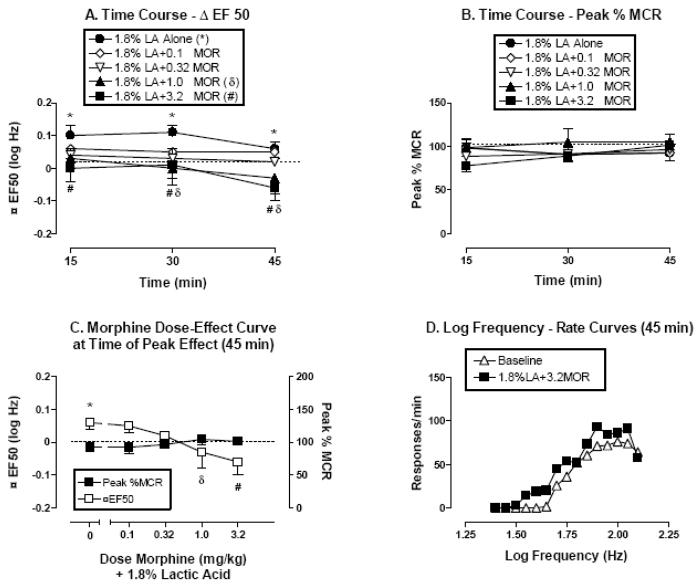
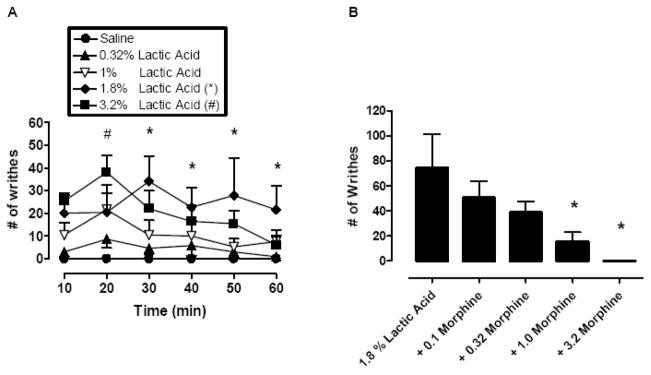
Pain stimulates some behaviors (e.g., withdrawal responses) but depresses many other behaviors (e.g., feeding). Pain-stimulated behaviors are widely used in preclinical research on pain and analgesia, but human and veterinary medicine often rely on measures of functional impairment and pain-depressed behavior to diagnose pain or assess analgesic efficacy. In view of the clinical utility of measures of pain-depressed behaviors, our laboratory has focused on the development of methods for preclinical assays of pain-depressed behavior in rodents. The present study compared the effects of a chemical noxious stimulus (IP lactic acid injections) and an opioid analgesic (morphine) administered alone or in combination on the stretching response (a pain-stimulated behavior) and intracranial self-stimulation (ICSS; a behavior that may be depressed by pain) in rats. In the ICSS procedure, rats implanted with electrodes in the lateral hypothalamus responded to electrical stimulation across a range of current frequencies to permit rapid determination of frequency-rate curves and evaluation of curve shifts following treatment. Lactic acid alone produced a concentration-dependent stimulation of stretching and depression of ICSS, expressed as rightward shifts in ICSS frequency-rate curves. Morphine had little effect alone, but it produced a dose-dependent blockade of both acid-stimulated stretching and acid-depressed ICSS. Both lactic acid and morphine were equipotent in the stretching and ICSS procedures. These results suggest that ICSS may be useful as a behavioral baseline for studies of pain-depressed behavior.
Figures

Similar articles
-
Expression and treatment of pain-related behavioral depression.Lab Anim (NY). 2013 Aug;42(8):292-300. doi: 10.1038/laban.255. Lab Anim (NY). 2013. PMID: 23877610 Free PMC article. Review.
-
Effects of μ-opioid receptor agonists in assays of acute pain-stimulated and pain-depressed behavior in male rats: role of μ-agonist efficacy and noxious stimulus intensity.J Pharmacol Exp Ther. 2015 Feb;352(2):208-17. doi: 10.1124/jpet.114.219873. Epub 2014 Nov 18. J Pharmacol Exp Ther. 2015. PMID: 25406170 Free PMC article.
-
Differential tolerance to morphine antinociception in assays of pain-stimulated vs. pain-depressed behavior in rats.Eur J Pharmacol. 2015 Feb 5;748:76-82. doi: 10.1016/j.ejphar.2014.12.011. Epub 2014 Dec 18. Eur J Pharmacol. 2015. PMID: 25530266 Free PMC article.
-
Effects of monoamine reuptake inhibitors in assays of acute pain-stimulated and pain-depressed behavior in rats.J Pain. 2013 Mar;14(3):246-59. doi: 10.1016/j.jpain.2012.11.006. Epub 2013 Jan 16. J Pain. 2013. PMID: 23332494 Free PMC article.
-
Determinants of opioid abuse potential: Insights using intracranial self-stimulation.Peptides. 2019 Feb;112:23-31. doi: 10.1016/j.peptides.2018.10.007. Epub 2018 Nov 1. Peptides. 2019. PMID: 30391425 Free PMC article. Review.
Cited by
-
Expression and treatment of pain-related behavioral depression.Lab Anim (NY). 2013 Aug;42(8):292-300. doi: 10.1038/laban.255. Lab Anim (NY). 2013. PMID: 23877610 Free PMC article. Review.
-
Effects of the fatty acid amide hydrolase inhibitor URB597 on pain-stimulated and pain-depressed behavior in rats.Behav Pharmacol. 2014 Apr;25(2):119-29. doi: 10.1097/FBP.0000000000000023. Behav Pharmacol. 2014. PMID: 24583930 Free PMC article.
-
Pain-related depression of the mesolimbic dopamine system in rats: expression, blockade by analgesics, and role of endogenous κ-opioids.Neuropsychopharmacology. 2014 Feb;39(3):614-24. doi: 10.1038/npp.2013.236. Epub 2013 Sep 6. Neuropsychopharmacology. 2014. PMID: 24008352 Free PMC article.
-
Dissociable effects of the cannabinoid receptor agonists Δ9-tetrahydrocannabinol and CP55940 on pain-stimulated versus pain-depressed behavior in rats.J Pharmacol Exp Ther. 2012 Nov;343(2):389-400. doi: 10.1124/jpet.112.197780. Epub 2012 Aug 14. J Pharmacol Exp Ther. 2012. PMID: 22892341 Free PMC article.
-
Involvement of the lateral amygdala in the antiallodynic and reinforcing effects of heroin in rats after peripheral nerve injury.Anesthesiology. 2011 Mar;114(3):633-42. doi: 10.1097/ALN.0b013e318209aba7. Anesthesiology. 2011. PMID: 21293255 Free PMC article.
References
-
- Adams WJ, Lorens SA, Mitchell CL. Morphine enhances lateral hypothalamic self-stimulation in the rat. Proc Soc Exp Biol Med. 1972;140(3):770–771. - PubMed
-
- Anisman H, Matheson K. Stress, depression, and anhedonia: caveats concerning animal models. Neurosci Biobehav Rev. 2005;29(4–5):525–546. - PubMed
-
- Bair MJ, Robinson RL, Katon W, Kroenke K. Depression and pain comorbidity: a literature review. Arch Intern Med. 2003;163(20):2433–2445. - PubMed
-
- Bennett GJ. Animal Models of Pain. In: Kruger L, editor. Methods in Pain Research. Vol. 4. Boca Raton, FL: CRC Press; 2001. pp. 67–91.
-
- Blackburn-Munro G. Pain-like behaviours in animals - how human are they? Trends Pharmacol Sci. 2004;25(6):299–305. - PubMed
Publication types
MeSH terms
Substances
Grants and funding
LinkOut - more resources
Full Text Sources
Medical
