. 2009 May;8(5):1055-66.
doi: 10.1158/1535-7163.MCT-08-1046. Epub 2009 May 12.

MicroRNA-200c mitigates invasiveness and restores sensitivity to microtubule-targeting chemotherapeutic agents

Affiliations

MicroRNA-200c mitigates invasiveness and restores sensitivity to microtubule-targeting chemotherapeutic agents

Dawn R Cochrane et al. Mol Cancer Ther. 2009 May.

Abstract

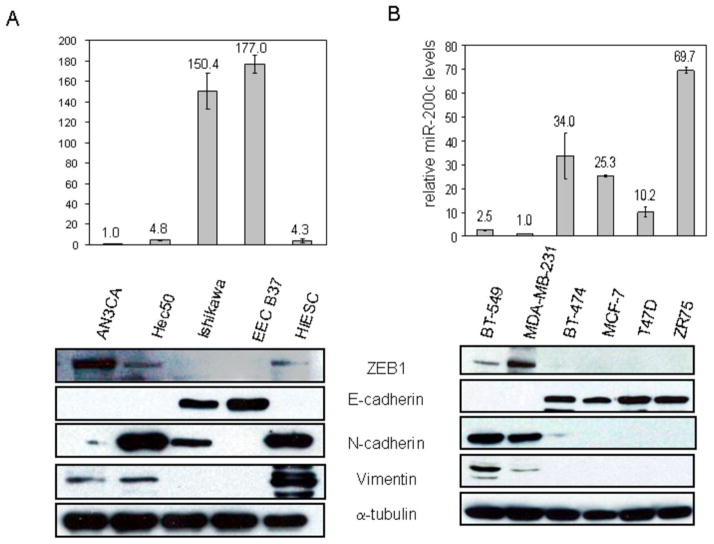
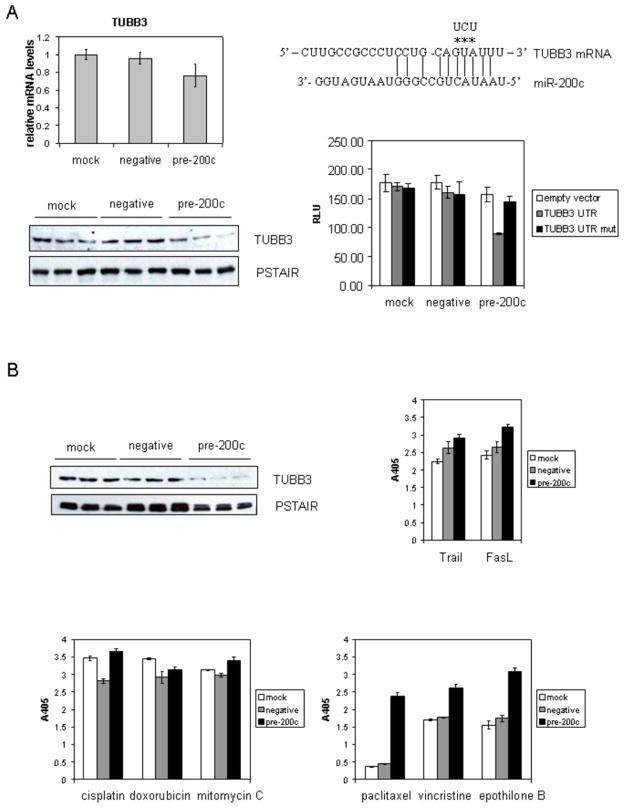
The transcription factor ZEB1 is normally not expressed in epithelial cells. When inappropriately expressed in carcinomas, ZEB1 initiates epithelial to mesenchymal transition due to its ability to repress E-cadherin and other genes involved in polarity. Recently, ZEB1 and ZEB2 have been identified as direct targets of the microRNA-200c family. We find that miR-200c levels are high in well-differentiated endometrial, breast, and ovarian cancer cell lines, but extremely low in poorly differentiated cancer cells. Low or absent miR-200c results in aberrant expression of ZEB1 and consequent repression of E-cadherin. Reinstatement of miR-200c to such cells restores E-cadherin and dramatically reduces migration and invasion. Microarray profiling reveals that in addition to ZEB1 and ZEB2, other mesenchymal genes (such as FN1, NTRK2, and QKI), which are also predicted direct targets of miR-200c, are indeed inhibited by addition of exogenous miR-200c. One such gene, class III β-tubulin (TUBB3), which encodes a tubulin isotype normally found only in neuronal cells, is a direct target of miR-200c. This finding is of particular significance because we show that restoration of miR-200c increases sensitivity to microtubule-targeting agents by 85%. Because expression of TUBB3 is a common mechanism of resistance to microtubule-binding chemotherapeutic agents in many types of solid tumors, the ability of miR-200c to restore chemosensitivity to such agents may be explained by its ability to reduce TUBB3. Because miR-200c is crucial for maintenance of epithelial identity, behavior, and sensitivity to chemotherapy, we propose that it warrants further investigation as a therapeutic strategy for aggressive, drug-resistant cancers.


Figures

Figure 1
Figure 1
MiR-200c and ZEB1 are inversely correlated in endometrial, breast, and ovarian cancer cells. A, RNA and protein were harvested from endometrial cancer cell lines - AN3CA and Hec50 (high-grade, representing Type II endometrial cancers), and Ishikawa (representing Type I endometrial cancer), EEC B37 (hTERT transformed normal endometrial epithelial cells) and HIESC (SV40 transformed normal endometrial stromal cells). RNA was assayed for miR-200c by real-time PCR (top panel). Immunoblots of whole cell protein extracts were probed for ZEB1, E-cadherin, N-cadherin, vimentin and α-tubulin as a loading control (bottom panel). B, RNA and protein were harvested from aggressive breast cancer cell lines (BT-549 and MDA 231) as well as the more differentiated cell lines (BT-474, MCF7, T47D and ZR75) for detection of miR-200c and immunoblot analysis of epithelial and mesencymal markers. C, Ovarian cell lines (2008, Hey, SKOV3, OVCA 420 and OVCA 433) were harvested and assayed as above. Each graph is representative of 3 independent experiments. For real-time RT-PCR, each bar represents the mean of quadruplicate samples and error bars represent standard error of the mean. MiR-200c levels are normalized to ribosomal RNA and are relative to AN3CA, MDA-MB-231, or 2008 cells respectively.
Figure 1
Figure 1
MiR-200c and ZEB1 are inversely correlated in endometrial, breast, and ovarian cancer cells. A, RNA and protein were harvested from endometrial cancer cell lines - AN3CA and Hec50 (high-grade, representing Type II endometrial cancers), and Ishikawa (representing Type I endometrial cancer), EEC B37 (hTERT transformed normal endometrial epithelial cells) and HIESC (SV40 transformed normal endometrial stromal cells). RNA was assayed for miR-200c by real-time PCR (top panel). Immunoblots of whole cell protein extracts were probed for ZEB1, E-cadherin, N-cadherin, vimentin and α-tubulin as a loading control (bottom panel). B, RNA and protein were harvested from aggressive breast cancer cell lines (BT-549 and MDA 231) as well as the more differentiated cell lines (BT-474, MCF7, T47D and ZR75) for detection of miR-200c and immunoblot analysis of epithelial and mesencymal markers. C, Ovarian cell lines (2008, Hey, SKOV3, OVCA 420 and OVCA 433) were harvested and assayed as above. Each graph is representative of 3 independent experiments. For real-time RT-PCR, each bar represents the mean of quadruplicate samples and error bars represent standard error of the mean. MiR-200c levels are normalized to ribosomal RNA and are relative to AN3CA, MDA-MB-231, or 2008 cells respectively.
Figure 2
Figure 2
Addition of exogenous miR-200c results in repression of ZEB1 and restoration of E-cadherin protein. Hec50 endometrial cancer cells (A) and MDA-MB-231 breast cancer cells (B) were treated with transfection reagent only (mock), scrambled negative control mimic (negative), or miR-200c mimic (pre-200c). After 48 hours, RNA was harvested and miR-200c levels were determined by real-time PCR as shown in the top panels. Means of quadruplicate samples are shown, with error bars representing standard error of the mean. The miR-200c levels are normalized to ribosomal RNA and are relative to mock transfection levels. Western blots of protein from the three experimental groups (mock, negative, or miR-200c treated) were probed for ZEB1, E-cadherin and α-tubulin as a loading control. Three replicates per treatment group are shown. For both real-time RT-PCR and western blots, results are representative of one of three independent experiments. C, Hec50 cells grown on cover slips were treated as above and fluorescent immunocytochemistry results using antibodies recognizing ZEB1 (red), E-cadherin (green) and DAPI (blue) are shown merged. The bottom panels show relevant IgG negative controls. Magnification 1000X.
Figure 3
Figure 3
Restoration of miR-200c expression in Hec50 decreases migration and invasion. A, Hec50 cells were treated with transfection reagent only, a scramble negative control or miR-200c mimic. After 48 hours, wounds were inflicted and pictures taken at 0, 4, 8, 12 and 24 hours post wounding. Lines indicate width of the wound at time zero. Pictures shown are from one experiment representative of three separate experiments (not shown). B, Mock, negative, or miR-200c transfected cells were subjected to a transwell migration assay. After 48 hours, cells on the bottom side of the membrane were stained and mounted onto slides and mean number of cells in four fields of vision on a cross-hatch were counted with error bars representing standard error of the mean of four replicates. Asterisk indicates a statistically significant difference between the numbers of cells migrating in the pre-200c, compared to either mock transfected cells or negative control treated cells (p-values of 2.8 × 10⁻⁴ and 6.0 × 10⁻⁸ respectively, Student’s t-test). Representative images (100X magnification) of stained filters are shown. C, Number of cells able to invade through matrigel coated Boyden chambers was also determined for each group. Again mean number of cells for four replicates are shown with error bars representing standard error of the mean and asterisk indicating a statistically significant difference between the pre-200c treated group, compared to either mock transfected cells or negative control treated cells (p-values of 0.0039 and 0.0020 respectively, Student’s t-test).
Figure 4
Figure 4
MiR-200c alters cell-death in response to microtubule-targeting chemotherapeutic agents specifically. Hec50 cells were treated with transfection reagent only (mock), scrambled negative control (negative), or miR-200c mimic (pre-200c). Twenty four hours post transfection, cells were treated with 0, 5, 10, 15, 20, or 25 nM paclitaxel (A) or 0, 20, 30, 40 or 50 μM cisplatin (B) and 24 hrs after drug treatment apoptosis was assayed using a Cell Death ELISA, with the data presented as percent maximum apoptosis. Error bars represent standard error of the mean of triplicate samples. This experiment was performed twice and representative experiments for each drug are shown. Asterisks indicate a statistically significant difference between pre-200c treated cells and mock or negative controls (p-value < 0.05, Student’s t-test). Hec50 cells treated with pre-200c or negative controls were treated with agents that cause apoptosis via (C) cell surface receptors (TRAIL, 50 ng/ml or FasL, 125 ng/ml), (D) DNA damage (doxorubicin, 1μg/ml or mitomycin C, 6μg/ml), or (E) microtubule poisons (Vincristine, 100 nM or Epothilone B, 100 nM) and Cell Death ELISAs were performed. Shown is the mean of 5 replicates. Error bars represent standard error of the mean. The experiment was repeated on three separate occasions with the same result, and a representative experiment is shown. Asterisks indicate statistically significant difference between pre-200c and both the mock and negative controls (p-value < 0.05, Student’s t-test).
Figure 5
Figure 5
Heatmap of genes significantly affected by restoration of miR-200c levels in Hec50 cells as determined by expression profiling. Hec50 cells were treated in triplicate with a mock transfection, negative control or pre-200c and gene expression analysis was performed on Affymetrix HGU133 Plus 2.0 oligonucleotide cDNA expression array chips. A, Genes with a statistically significant (ANOVA), 1.5 fold or greater upregulation (red) or downregulation (green) in the pre-200c treated cells versus both the negative control and the mock transfected cells are shown in a heatmap. Expected alterations in E-cadherin (CDH1) and ZEB1 are highlighted. B, Genes 1.5 fold or greater up- or downregulated in the pre-200c treated cells versus either negative control are shown in a separate heatmap. C, A heatmap of genes from A or B that are bioinformatically predicted to be targets of miR-200c. D, Genes differentially regulated by miR-200c implicated in cell migration as determined by Ingenuity Pathway Analysis. Note that each gene was normalized to its average expression over the 9 chips, such that the intensities center around one and are presented on a scale of −2 to +2 and are thus not indicative of relative fold changes. Fold changes and p-values for these genes are listed in a table as supplemental data.
Figure 6
Figure 6
Select genes altered by restoration of miR-200c are validated by RT-PCR. SYBR green real time RT-PCR was performed on Hec50 cells treated with transfection reagent only (mock), 60 nM of a scramble negative control (negative), or 60 nM of the miR-200c mimic (pre-200c) using primers specific for CHK2, ARHGDIB, EPHB1, MAL2, LEPR and ST6GALNAC5. Error bars represent the standard error of the mean of three replicates.
Figure 7
Figure 7
A site in the TUBB3 3′ UTR is a direct target of miR-200c and a decrease in TUBB3 protein corresponds with an increase in cell death in response to microtubule- targeting agents. A, SYBR green real time RT-PCR using primers specific for TUBB3 was performed on RNA from Hec50 cells treated with pre-miR-200c mimic (pre-200c), negative scrambled control (negative) or mock transfected (mock) control (top left). A corresponding western blot consisting of protein from the same cells was probed for TUBB3 (bottom left) and PSTAIR (used as a loading control). A fragment of the TUBB3 3′UTR (located 117–379 base pairs after the stop codon) containing the putative miR-200c binding site, or the same fragment with the indicated base pairs that bind to the miR-200c seed sequence mutated, were cloned into pMIR-REPORT, luciferase reporter vector. These constructs, empty pMIR-Report vector, vector containing wild-type TUBB3 3′ UTR, or mutated TUBB3 3′UTR (TUBB3 UTR mut), were transfected into Hec50 cells following either transfection with either negative control, pre-200c, or mock transfection. A dual reporter luciferase assay was performed and relative luciferase units (RLU) calculated as firefly luciferase values divided by renilla values. Shown are the mean of five replicate samples and error bars represent standard error of the mean. Single asterisk indicates a P-value of 0.041 for the statistically significant difference in the amount of luciferase detected when the wild-type TUBB3 UTR is in the presence of pre-200c versus negative control. Two asterisks indicates a P-value of 0.006 for the difference in the amount of luciferase in the presence of pre-200c and either the empty vector or wild type TUBB3 3′UTR containing reporter. Three asterisks indicates a P-value of 0.003 for the difference between the amount of luciferase measured when it is targeted by wild-type versus mutated TUBB3 3′UTR. B, An aggressive ovarian cancer cell line, Hey, was treated with pre-200c, a negative control or mock transfection. Western blot for TUBB3 with PSTAIR as a loading control is shown on the top left. A Cell Death ELISA was performed on the mock, negative control, or pre-200c transfected Hey cells treated with various chemotherapeutic agents; top right panel shows Trail and FasL, bottom left panel shows cisplatin, doxorubicin and mitomycin C, and bottom right panel shows paclitaxel, vincristine and epothilone B. Asterisks indicate statistically significant differences (as determined by Student’s t-tests) between the pre-200c treated cells versus negative and mock transfected controls individually (p-values of 5.8 × 10⁻⁵ and 7.9 × 10⁻⁵ for pre-200c versus mock and negative control respectively in the paclitaxel treated group, p-values of 0.0005 and 0.0009 for pre-200c versus mock and negative control in the vincristine treated group, and p-values of 1.3 × 10⁻⁵ and 2.3 × 10⁻⁵ pre-200c versus mock and negative control in the epothilone B treated group).

References

    1. Singh M, Spoelstra NS, Jean A, et al. ZEB1 expression in type I vs type II endometrial cancers: a marker of aggressive disease. Mod Pathol. 2008;21:912–923. - PubMed
    1. Spoelstra NS, Manning NG, Higashi Y, et al. The transcription factor ZEB1 is aberrantly expressed in aggressive uterine cancers. Cancer Res. 2006;66:3893–3902. - PubMed
    1. Eger A, Aigner K, Sonderegger S, et al. DeltaEF1 is a transcriptional repressor of E-cadherin and regulates epithelial plasticity in breast cancer cells. Oncogene. 2005;24:2375–2385. - PubMed
    1. Guaita S, Puig I, Franci C, et al. Snail induction of epithelial to mesenchymal transition in tumor cells is accompanied by MUC1 repression and ZEB1 expression. J Biol Chem. 2002;277:39209–39216. - PubMed
    1. Ohira T, Gemmill RM, Ferguson K, et al. WNT7a induces E-cadherin in lung cancer cells. Proc Natl Acad Sci U S A. 2003;100:10429–10434. - PMC - PubMed

Publication types

MeSH terms