. 2009 Jul 10;284(28):18624-33.
doi: 10.1074/jbc.M109.008797. Epub 2009 May 12.

PPAR{delta} agonism activates fatty acid oxidation via PGC-1{alpha} but does not increase mitochondrial gene expression and function

Affiliations

PPAR{delta} agonism activates fatty acid oxidation via PGC-1{alpha} but does not increase mitochondrial gene expression and function

Sandra Kleiner et al. J Biol Chem. .

Abstract

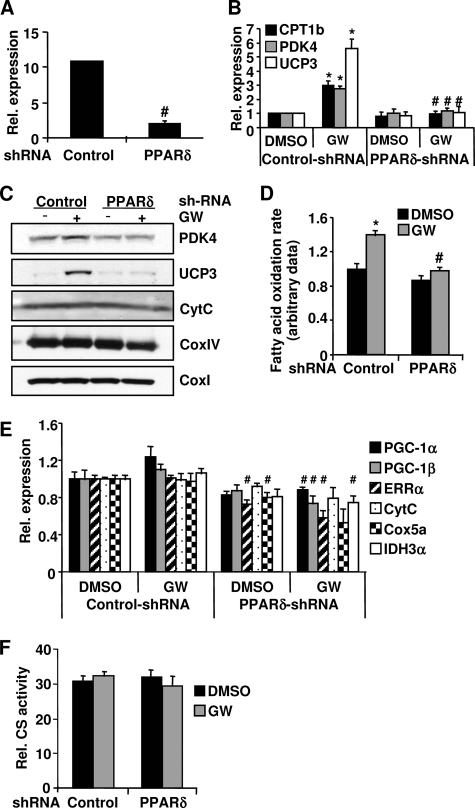
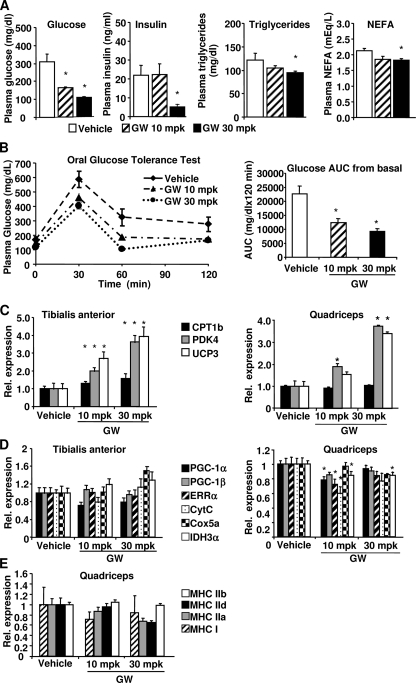
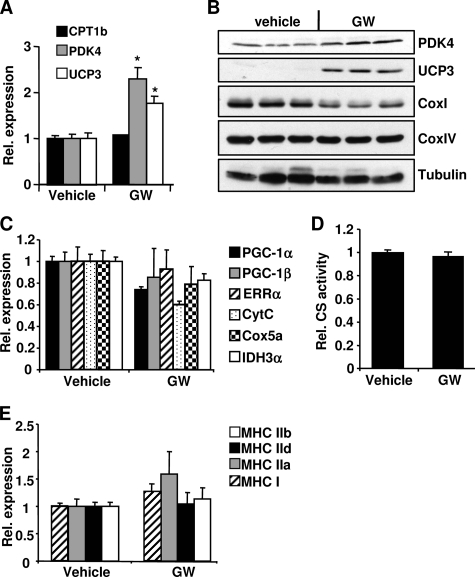
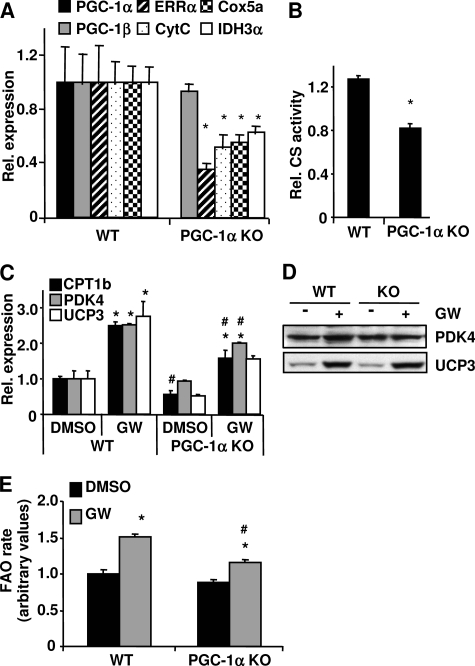
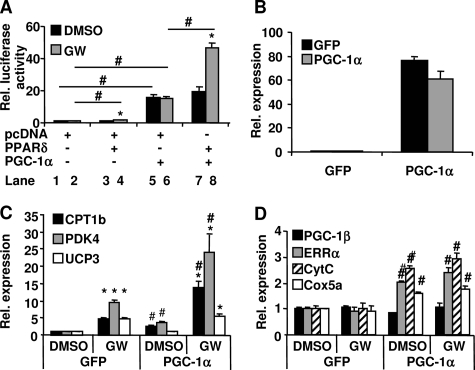
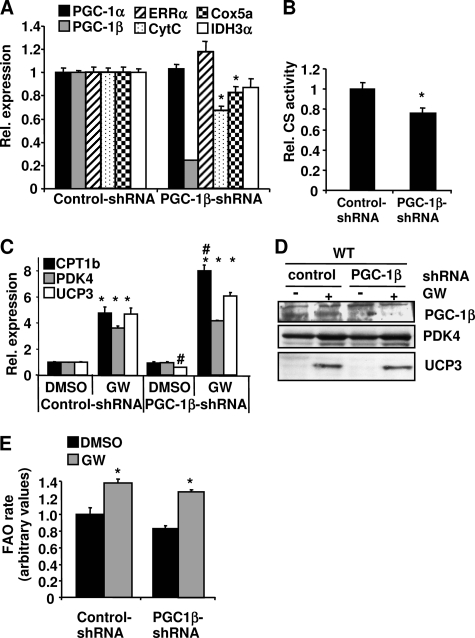
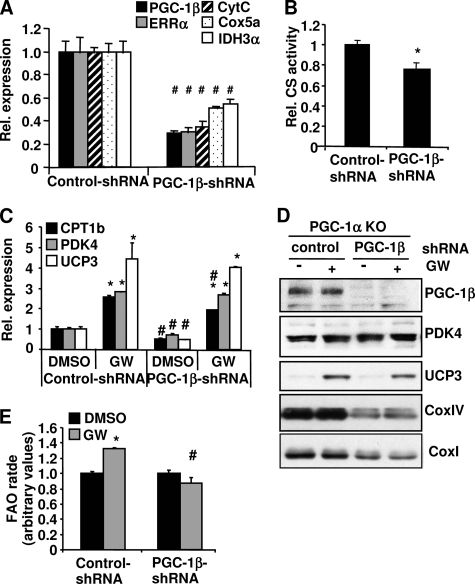
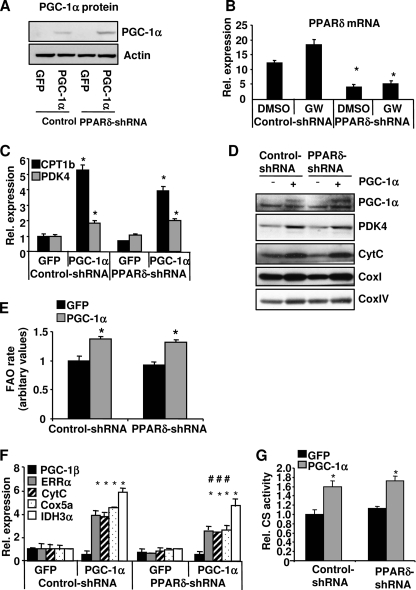
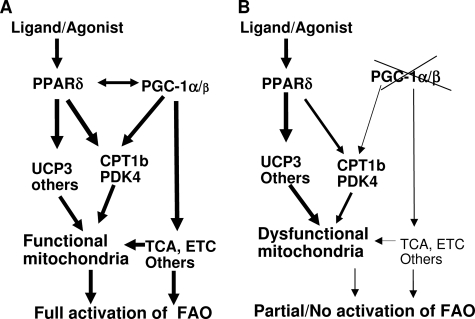
PPARdelta (peroxisome proliferator-activated receptor delta) is a regulator of lipid metabolism and has been shown to induce fatty acid oxidation (FAO). PPARdelta transgenic and knock-out mice indicate an involvement of PPARdelta in regulating mitochondrial biogenesis and oxidative capacity; however, the precise mechanisms by which PPARdelta regulates these pathways in skeletal muscle remain unclear. In this study, we determined the effect of selective PPARdelta agonism with the synthetic ligand, GW501516, on FAO and mitochondrial gene expression in vitro and in vivo. Our results show that activation of PPARdelta by GW501516 led to a robust increase in mRNA levels of key lipid metabolism genes. Mitochondrial gene expression and function were not induced under the same conditions. Additionally, the activation of Pdk4 transcription by PPARdelta was coactivated by PGC-1alpha. PGC-1alpha, but not PGC-1beta, was essential for full activation of Cpt-1b and Pdk4 gene expression via PPARdelta agonism. Furthermore, the induction of FAO by PPARdelta agonism was completely abolished in the absence of both PGC-1alpha and PGC-1beta. Conversely, PGC-1alpha-driven FAO was independent of PPARdelta. Neither GW501516 treatment nor knockdown of PPARdelta affects PGC-1alpha-induced mitochondrial gene expression in primary myotubes. These results demonstrate that pharmacological activation of PPARdelta induces FAO via PGC-1alpha. However, PPARdelta agonism does not induce mitochondrial gene expression and function. PGC-1alpha-induced FAO and mitochondrial biogenesis appear to be independent of PPARdelta.


Figures

FIGURE 1.
FIGURE 1.
GW501516-induced effects on FAO and mitochondrial gene expression in primary myotubes. Primary myotubes were infected with PPARδ shRNAs or a control shRNA adenovirus. At 48 h post-transduction, the cells were treated with 100 nm GW501516 (23) or DMSO for 24 h. Total RNA was extracted from cells, and the mRNA levels of the indicated genes were determined by quantitative PCR (A, B, and E). D, cells were labeled with 14C-palmitate, and FAO rates were determined. The FAO rate in the control cells treated with DMSO was set at 1, and the FAO rates under other conditions were expressed as -fold change relative to that in the control cells treated with DMSO. C, cells were lysed in RIPA buffer, and protein lysate from each sample was used for Western blotting. F, cells were lysed, and CS activities were determined. Data are mean ± S.E. (n = 3). *, p ≤ 0.05 for DMSO versus GW; #, p ≤ 0.05 for control versus PPARδ shRNA. CytC, cytochrome c.
FIGURE 2.
FIGURE 2.
GW501516-induced effects on glucose homeostasis and muscle mitochondrial gene expression in ob/ob mice. ob/ob mice were treated once daily with 10 or 30 mg/kg (mpk) GW501516 for 3 weeks. A, plasma glucose, insulin, and nonesterified free fatty acids were measured at day 19 post-treatment after 4 h fast (n = 8). B, oral glucose tolerance test and glucose area under the curve (AUC) from basal versus vehicle. n = 8. *, p ≤ 0.05. C–E, tibilias anterior and quadriceps were isolated, RNA was extracted, and quantitative PCR was performed to determine the mRNA levels of the indicated genes. Data are mean ± S.E. (n = 7–8). *, p ≤ 0.05 for vehicle versus GW501516. CytC, cytochrome c.
FIGURE 3.
FIGURE 3.
GW501516-induced effects on muscle mitochondrial gene expression in lean C57BL/6 mice. Mice were gavaged once daily with 30 mg/kg GW501516 for 4 weeks. Gastrocnemius was isolated, RNA was extracted, and Q-PCR was performed to determine the mRNA levels of the indicated genes (A, C, and E). B, protein was extracted from gastrocnemius muscle isolated from mice. Protein lysate from each sample was used for Western blotting. D, citrate synthase activity was determined in the protein lysate from gastrocnemius muscles. Data are mean ± S.E. (n = 7–8). *, p ≤ 0.05 for vehicle versus GW. CytC, cytochrome c.
FIGURE 4.
FIGURE 4.
GW501516-mediated gene expression and FAO in PGC-1α KO myotubes. Primary WT and PGC-1α KO myotubes were treated with 100 nm GW501516 for 24 h. A and C, RNA was extracted, and the mRNA levels for the indicated genes were measured by quantitative PCR. B, cells were lysed, and CS activity was measured. D, cells were lysed in RIPA buffer, and protein lysate was subjected to Western blot analysis. E, cells were labeled with 14C-palmitate, and FAO rates were measured. Data are mean ± S.E. (n = 3). *, p ≤ 0.05 for DMSO versus GW; #, p ≤ 0.05 for WT versus PGC-1α KO. CytC, cytochrome c.
FIGURE 5.
FIGURE 5.
Effect of PGC-1α on GW501516-mediated FAO and mitochondrial gene expression. A, HeLa cells were transfected with PDK4-luciferase reporter and the indicated expression vectors for 24 h followed by a 24-h treatment with either DMSO or GW501516 (100 nm). The luciferase activity, indicative of PDK4 transcription, was measured. Data are mean ± S.E. (n = 8). *, p ≤ 0.05 for DMSO versus GW; #, p ≤ 0.05 for the comparison as indicated. B–D, C2C12 myotubes were transduced with either the PGC-1α or GFP adenovirus for 48 h and then treated with DMSO or 100 nm GW501516 for 24 h. RNA was extracted, and the mRNA levels of the indicated genes were measured by quantitative PCR. Data are mean ± S.E. (n = 3). *, p ≤ 0.05 for DMSO versus GW; #, p ≤ 0.05 for GFP versus PGC-1α. CytC, cytochrome c.
FIGURE 6.
FIGURE 6.
Effect of PGC-1β knockdown on GW501516-mediated gene expression and FAO. Primary myotubes were infected with the PGC-1β shRNA or a control adenovirus for 72 h and then treated with either 100 nm GW501516 or DMSO for the last 24 h. A and C, RNA was extracted, and the mRNA levels of the indicated genes were measured by quantitative PCR. B, cells were lysed, and CS activities were determined. D, cells were lysed in RIPA buffer. Protein lysate from each sample was subjected to Western blot analysis. E, cells were labeled with 14C-palmitate, and FAO rates were measured. The FAO rate in the control/DMSO was set at 1, and the FAO rates under other conditions were expressed as -fold change relative to the control/DMSO. Data are mean ± S.E. (n = 3). *, p ≤ 0.05 for DMSO versus GW; #, p ≤ 0.05 for control versus PGC-1β shRNA. CytC, cytochrome c.
FIGURE 7.
FIGURE 7.
The effect of knockdown PGC-1β on GW501516-mediated gene expression and FAO in the PGC-1α KO myotubes. The PGC-1α null myotubes were transduced with PGC-1β shRNA or a control adenovirus for 72 h and then treated with DMSO or 100 nm GW501516 (23) for the last 24 h. A and C, RNA was extracted, and the mRNA levels of the indicated genes were measured by quantitative PCR. B, cells were lysed, and CS activities were determined. D, cells were lysed in RIPA buffer, and 10–40 ng of protein extract was used for Western blotting. E, cells were labeled with 14C-palmitate, and FAO rates were measured. The FAO rate in the control/DMSO was set at 1, and the FAO rates under other conditions were expressed as -fold change relative to the control/DMSO. Data are mean ± S.E. (n = 3). *, p ≤ 0.05 for DMSO versus GW; #, p ≤ 0.05 for control versus PGC-1β shRNA. CytC, cytochrome c.
FIGURE 8.
FIGURE 8.
Effect of PPARδ knockdown on PGC-1α-mediated FAO and mitochondrial gene expression. Primary myotubes were transduced with PPARδ shRNA or a control adenovirus. The next day, the cells were transduced with either the PGC-1α or GFP adenovirus for 48 h. A, cells were lysed and subjected to Western blot analysis to measure PGC-1α protein levels. B, C, E, and F, RNA was extracted, and the mRNA levels of the indicated genes were measured by quantitative PCR. D, cells were labeled with 14C-palmitate, and FAO rates were measured. E, cells were lysed in RIPA buffer, and 10–40 ng of protein extract was used for Western blotting. G, cells were lysed, and CS activities were determined. Data are mean ± S.E. (n = 3). *, p ≤ 0.05 for GFP versus PGC-1α; #, p ≤ 0.05 for control versus PPARδ shRNA. CytC, cytochrome c.
FIGURE 9.
FIGURE 9.
A proposed model by which PGC-1 coactivators and PPARδ regulate FAO. A, in the presence of PGC-1 coactivators, the mitochondria are furnished with a functional β-oxidation, tricarboxylic acid cycle (TCA), and electron transport chain (ETC). PGC-1α and PPARδ activate Cpt-1b and Pdk4 genes synergistically in a ligand-dependent manner, which results in an increase in fatty acid β-oxidation. The fatty acids are completely oxidized to CO2 to generate ATP in the functional mitochondria. B, in the absence of PGC-1 coactivators, PPARδ-driven Pdk4 and Cpt-1b gene expression is reduced due to a lack of coactivation by PGC-1α. Other genes important for β-oxidation and components of the tricarboxylic acid cycle and ETC are markedly decreased in the absence of PGC-1s, which in turn may hinder fat oxidation mediated by PPARδ agonism.

References

    1. Takahashi S., Tanaka T., Sakai J. (2007) Endocr. J. 54, 347–357 - PubMed
    1. Braissant O., Foufelle F., Scotto C., Dauça M., Wahli W. (1996) Endocrinology 137, 354–366 - PubMed
    1. Wang Y. X., Zhang C. L., Yu R. T., Cho H. K., Nelson M. C., Bayuga-Ocampo C. R., Ham J., Kang H., Evans R. M. (2004) PLoS Biol. 2, e294. - PMC - PubMed
    1. Luquet S., Lopez-Soriano J., Holst D., Fredenrich A., Melki J., Rassoulzadegan M., Grimaldi P. A. (2003) FASEB J., 03–0269fje - PubMed
    1. Handschin C., Spiegelman B. M. (2006) Endocr. Rev. 27, 728–735 - PubMed

LinkOut - more resources