. 2009 May;21(5):1428-52.
doi: 10.1105/tpc.108.060830. Epub 2009 May 12.

Regulatory features underlying pollination-dependent and -independent tomato fruit set revealed by transcript and primary metabolite profiling

Affiliations

Regulatory features underlying pollination-dependent and -independent tomato fruit set revealed by transcript and primary metabolite profiling

Hua Wang et al. Plant Cell. 2009 May.

Abstract

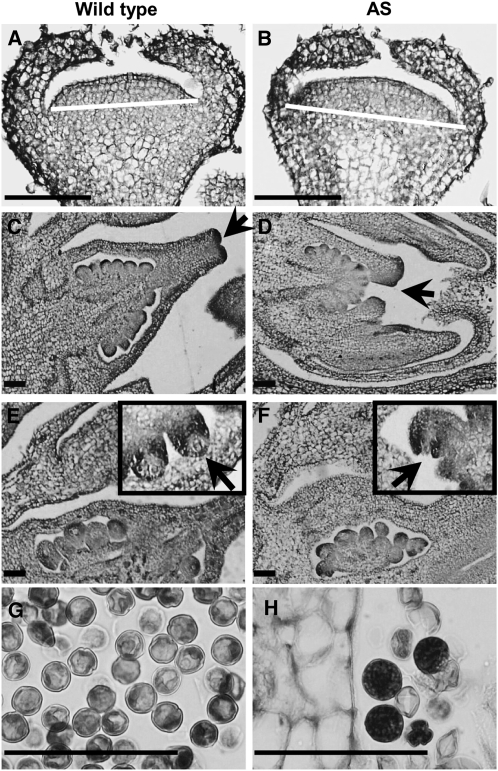
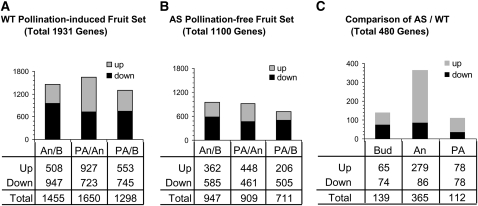
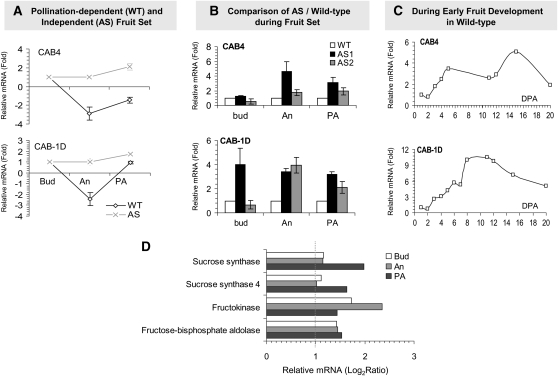
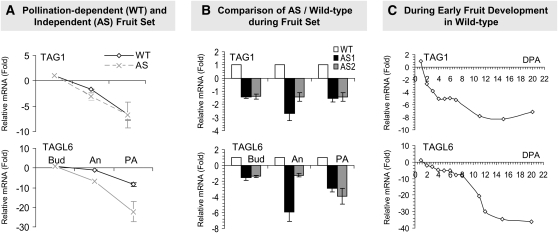
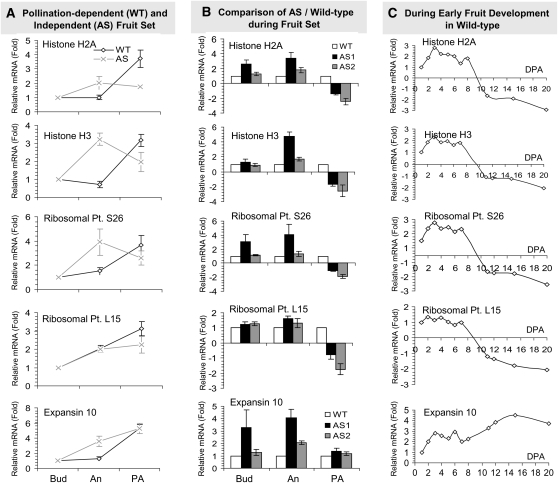
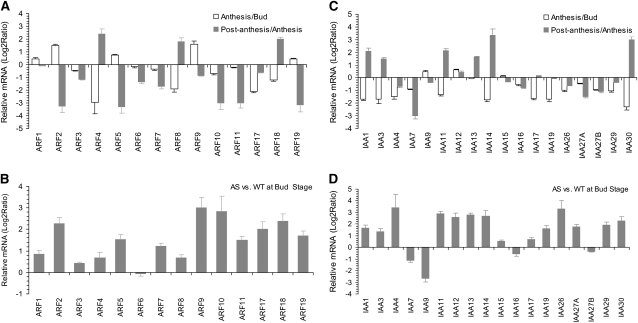
Indole Acetic Acid 9 (IAA9) is a negative auxin response regulator belonging to the Aux/IAA transcription factor gene family whose downregulation triggers fruit set before pollination, thus giving rise to parthenocarpy. In situ hybridization experiments revealed that a tissue-specific gradient of IAA9 expression is established during flower development, the release of which upon pollination triggers the initiation of fruit development. Comparative transcriptome and targeted metabolome analysis uncovered important features of the molecular events underlying pollination-induced and pollination-independent fruit set. Comprehensive transcriptomic profiling identified a high number of genes common to both types of fruit set, among which only a small subset are dependent on IAA9 regulation. The fine-tuning of Aux/IAA and ARF genes and the downregulation of TAG1 and TAGL6 MADS box genes are instrumental in triggering the fruit set program. Auxin and ethylene emerged as the most active signaling hormones involved in the flower-to-fruit transition. However, while these hormones affected only a small number of transcriptional events, dramatic shifts were observed at the metabolic and developmental levels. The activation of photosynthesis and sucrose metabolism-related genes is an integral regulatory component of fruit set process. The combined results allow a far greater comprehension of the regulatory and metabolic events controlling early fruit development both in the presence and absence of pollination/fertilization.


Figures

Figure 1.
Figure 1.
Comparison of Wild-Type and AS-IAA9 Ovary/Fruit Development during Fruit Set. (A) AS-IAA9 lines exhibit precocious fruit set prior to anthesis, resulting in abnormal parallel development of fruit and flower at anthesis stage. (B) Impact of pollination on fruit size at 8 DPA. +P, pollinated; −P, nonpollinated. Bar = 8 mm. (C) Percentage of fruit set (the transition from flower to fruit and subsequent fruit development) from emasculated and pollinated flowers in wild-type and AS-IAA9 lines. (D) Ovary/fruit diameter in wild-type and AS-IAA9 lines at anthesis (An) and 8 d postemasculation (DPE). (E) Accelerated ovary-fruit enlargement in AS-IAA9 (AS) compared with the wild type. In (C) to (E), error bars represent ± se of three independent trials, for each trial n ≥ 20. AS, IAA9-antisense lines; Bud, flower bud; An, anthesis.
Figure 2.
Figure 2.
Histological Analysis of Organ Differentiation Program in Wild-Type and AS-IAA9 Flowers. (A) and (B) Floral meristem is larger in AS-IAA9 line (AS) than in the wild type as indicated by white bars. (C) and (D) In 2-mm-long flower buds, wild-type lines exhibit fully fused carpels, whereas at the same size, carpels are still growing toward fusion (arrows) in AS-IAA9. (E) and (F) In 4-mm-long flower buds, the nucellus is already completely enveloped by the integuments in the wild type, whereas it is still not fully covered by the integuments in AS-IAA9 lines (insets). (G) and (H) In mature flowers (anthesis stage), a high proportion of pollen grains are aborted in antisense lines compared with the wild type. Nonaborted pollens are significantly bigger and intensely colored in antisense lines compared with the wild type. Bars = 100 μm.
Figure 3.
Figure 3.
In Situ Hybridization Reveals That Pollination Triggers the Release of the IAA9 Transcript Gradient. (A) Low background signal detected in control hybridization experiment performed with IAA9 sense probe. (B) IAA9 mRNAs are distributed all over the floral meristem, with higher accumulation in emerging organs, such as petals, stamen, and carpel. Signal intensity is higher in the adaxial sides of the emerging stamen. (C) to (G) IAA9 mRNA signal increases throughout flower development with uneven distribution leading to the formation of a gradient peaking at anthesis stage. Flowers from all the stages analyzed were put in the same slide and were therefore developed for the same amount of time. (H) to (J) Pollinated ovaries at 1, 3, and 5 d after pollination (DPP). Pollination results in a rapid release of the IAA9 gradient leading to a net decrease in IAA9 mRNA accumulation in the placenta, funiculus, and inner integument of embryonic sac. (K) Close-up examination of fertilized ovule. Successful fertilization releases the IAA9 mRNA gradient, resulting in a spreading of the IAA9 signal all over the developing ovule. (L) to (N) Emasculated ovaries at 1, 3, and 5 DPE. In the absence of pollination, emasculated flowers retain the IAA9 expression gradient and display an arrest of ovary development. (O) Close-up examination of unfertilized ovule shows that 3 d after emasculation, a strong IAA9 mRNA gradient is maintained with a high signal detected in cell layers of inner integuments and funiculus tissues. Magnification is ×5 in (C) to (J) and (L) to (N) and ×40 in (A), (B), (K), and (O). Bars = 100 μm. sp, sepal; sm, stamen; cap, carpels; sl, style; spg, sporogenous tissue; tap, tapetum; c, columella; ow, ovary wall; pl, placenta; f, funiculus; v, vascular bundles; es, embryo sac.
Figure 4.
Figure 4.
Experimental Design for Analyzing Transcriptomic and Metabolomic Changes Associated with Fruit Set in the Wild Type and AS-IAA9. Combined transcriptomic and metabolomic approaches were used to investigate the molecular events associated with pollination-induced natural fruit set in the wild type (A), pollination-independent fruit set in AS-IAA9 (AS) (B), and to identify differentially expressed genes or altered metabolites in antisense (AS) fertilization-free fruit set versus pollination-dependent fruit set in the wild type (C). Bud (equivalent to 2 d before anthesis, −2 DPA), anthesis (An), and postanthesis (PA; 4 DPA) stages were considered. For transcriptome analyses, a direct comparison of AS-IAA9 lines to their wild-type counterpart was employed. At each of the three developmental stages, Cy-labeled cDNAs were hybridized to six independent 12k-oligomicroarrays (EU-TOM1) using a triple dye-swap design. The abundance of a broad range of metabolites was quantified using GC-MS. Fruit/ovary tissues were pooled from wild-type (cv MicroTom) and AS-IAA9 homozygous lines, and the samples were split into two parts, one to be used in microarray hybridization and the other in metabolite quantification. Cy3, cyanine3 fluor; Cy5, cyanine5 fluor; AS, IAA9 antisense lines; qPCR, quantitative real-time PCR.
Figure 5.
Figure 5.
Venn Diagram of Fruit Set–Associated Genes. Venn diagram showing genes differentially expressed during the three stages of flower-to-fruit transition in the wild type (red circle) and AS-IAA9 (AS; yellow circle) tomato and differentially expressed between pollination-dependent and -independent fruit set (AS versus WT, blue circle). Overlap between each set of genes is indicated by different colors. Total numbers of differentially expressed genes are indicated in white boxes; the number of genes in each subset is indicated within the appropriate colored domain.
Figure 6.
Figure 6.
Global Gene Expression Pattern in Pollination-Dependent and -Independent Fruit Set. (A) and (B) Differentially expressed genes (either up- or downregulated) during the transition from flower bud to anthesis and from anthesis to postanthesis in natural pollination-induced fruit set of wild-type plants (A) and pollination-free fruit set in antisense (AS) lines (B). (C) Differentially expressed genes between AS and the wild type during fruit set at three developmental stages: bud (B), anthesis (An), and postanthesis (PA). Upregulated (Up), downregulated (Down), and total altered genes (total) refer to changes in transcript accumulation displaying log2 (ratio) higher than 0.5 or lower than −0.5 (P value = 0.05).
Figure 7.
Figure 7.
Expression Analysis of Genes Involved in Photosynthetic Processes and Sugar Metabolism. (A) Expression kinetics of selected photosynthetic genes during pollination-dependent fruit set in wild-type (black line) and pollination-free fruit set in AS-IAA9 (gray line) assessed by qRT-PCR. cDNA were prepared from the same RNA samples used in the microarray experiment. Data are expressed as relative values, based on the values of bud ovary taken as reference sample set to 1. (B) Comparison of transcript levels between the wild type (white bar) and two independent AS-IAA9 lines AS1 (black bar) and AS2 (gray bar) assessed by qRT-PCR at three developmental stages. Data are expressed as relative values, based on the reference wild-type samples set to 1.0 at each stage considered. (C) Transcript accumulation during early stage of natural pollination-induced fruit set in the wild type. Relative expression levels for stages 2 to 20 DPA were determined based on the reference 1 DPA sample set to 1.0. CAB4, chlorophyll a/b binding protein 4; CAB-1D, chlorophyll a/b Binding Protein1D. Error bars represent ± se of four biological repetitions. (D) Comparative transcript accumulation in the wild type at different stages of genes involved in sugar metabolism identified by microarray analysis as differentially expressed between wild-type and antisense lines.
Figure 8.
Figure 8.
Expression Analysis of Two MADS Box Genes Assessed by qRT-PCR. (A) Expression kinetics of two MADS box genes (TAG1 and TAGL6) during pollination-dependent (wild-type, black line) and pollination-free (AS-IAA9, gray line) fruit set. Data are expressed as relative values based on bud ovary taken as reference sample set to 1.0. (B) Comparison of transcript levels between wild-type (white bar) and two independent AS-IAA9 lines AS1 (black bar) and AS2 (gray bar) at three developmental stages. Data are expressed as relative values, based on the reference wild-type samples set to 1.0. (C) Transcript accumulation during early stage of natural pollination-induced fruit set in the wild type. Relative expression levels for stages 2 to 20 DPA were determined based on the reference value of 1 DPA sample set to 1.0. TAG1, Tomato Agamous 1; TAGL6, Tomato Agamous-like6. Error bars represent ± se of four biological repetitions.
Figure 9.
Figure 9.
Expression Analysis of Cell Division–Related Genes Assessed by qRT-PCR. (A) Expression kinetics of two histone genes (Histone H2A and Histone H3), two ribosomal protein genes (Ribosomal Pt. S26 and Ribosomal Pt. L15), and Expansin 10 gene during pollination-dependent (wild-type, black line) and pollination-free (AS-IAA9; gray line) fruit set. Data are expressed as relative values, based on bud ovary taken as reference sample set to 1. (B) Comparison of transcript levels between wild-type (white bar) and two independent AS-IAA9 lines AS1 (black bar) and AS2 (gray bar) at three developmental stages. Data are expressed as relative values, based on the reference wild-type sample set to 1.0. (C) Transcript accumulation during early stage of natural pollination-induced fruit set in the wild type. Relative expression levels for stages 2 to 20 DPA were determined based on the reference 1 DPA sample set to 1.0. Error bars represent ± se of four biological repetitions.
Figure 10.
Figure 10.
Expression Analysis of Hormone-Related Genes. (A) Expression of hormone-related genes differentially expressed during pollination-dependent fruit set in the wild type (left panel) and pollination-free fruit set in AS-IAA9 (right panel). The most prominent groups are shaded gray. The category called “Others” includes abscisic acid, jamonic acid, and salicylic acid. (B) to (D) Expression analysis assessed by qRT-PCR of auxin response-related genes (B), ethylene response-related genes (C), and GA response-related genes (D). Left panel, expression kinetics of selected hormone-related genes during pollination-dependent fruit set in the wild type (black line) and pollination-free fruit set in AS-IAA9 (gray line); data are expressed as relative values, based on the reference bud ovary sample set to 1.0. Middle panel, comparison of transcript levels between wild-type (white bar) and two independent AS-IAA9 lines AS1 (black bar) and AS2 (gray bar) at three developmental stages. Data are expressed as relative values, based on the reference wild-type samples set to 1.0. Right panel, transcript accumulation during early stage of natural pollination-induced fruit set in the wild type. Relative expression levels for stages 2 to 20 DPA were determined based on the reference 1 DPA sample set to 1.0. ARG, auxin-repressed gene; ARP, auxin-regulated gene; ACO1, ACC oxidase1. Error bars represent ± se of four biological repetitions.
Figure 11.
Figure 11.
Expression Profile of Auxin Response Transcription Factors during Fruit Set. (A) and (C) Expression profile of ARF (A) and Aux/IAA (C) during pollination-induced fruit set in wild-type lines. Data are expressed as relative values, white bars indicate the relative transcripts level in anthesis stage compared with bud stage, and dark-gray bars indicate level in postanthesis stage compared with anthesis stage. (B) and (D) Expression profile of ARFs (B) and Aux/IAAs (D) in AS-IAA9 pollination-free fruit set lines. Data are expressed as relative values, which indicate the relative transcript levels in AS-IAA9 lines compared with the wild type at bud stage. Expression analysis was assessed by real-time PCR, and data are expressed as relative value log2 ratio.
Figure 12.
Figure 12.
Comparative Analyses of Metabolic Changes Associated with Pollination-Dependent and -Independent Fruit Set. White bars represent metabolic changes during pollination-dependent fruit set in the wild type. The relative metabolite level of anthesis (An/B) and postanthesis (PA/B) were determined compared with that of wild-type flower bud, which was set to 1.0. Gray bars show the metabolic change during pollination-independent fruit set in AS-IAA9. The relative metabolite level of anthesis and postanthesis were determined compared with that of AS-IAA9 flower bud, which was set to 1.0. Black bars present changes in the metabolite profile in antisense line AS1 compared with wild-type lines during flower-to-fruit transition at three different developmental stages of bud, An (anthesis), and PA (postanthesis). The relative metabolite level was determined compared with that of the wild type at each stage. The dotted lines in the diagrams reflect the normalized control (1.0). The changes are represented as means ± se of determinations of six individual pooled samples. An asterisk indicates changes deemed by the Student's t test (P < 0.05) to be statistically significant.
Figure 13.
Figure 13.
Integrated Analysis of Transcriptional and Metabolic Changes. The left-hand side the figure shows the color-coded results of a Wilcoxon test for a consistent upregulation (blue) or downregulation (red) of individual processes for the whole data set (columns 1 to 3). Average levels of metabolites as well as averages of metabolites per process are also color coded in the same manner (columns 4 to 6). In the panel on the right-hand side, individual processes are magnified, and processes or metabolites are labeled individually. The results of the Wilcoxon test are shown in the first columns. The next columns show individual metabolites or the averages of individual enzyme classes. Processes or enzyme classes not flagged as significant have been omitted for clarity. The three independent graphs represent changes in the wild type (A), IAA9 antisense line (B), and the comparison of these genotypes obtained by dividing the log2 transformed values of the antisense by similarly transformed values of the wild type (C).
Figure 14.
Figure 14.
PCA of Transcripts and Metabolites during the Flower-to-Fruit Transition. Score plot of two principle components of transcripts and metabolites showing that developmental stages as well as different genotypes (wild type and AS-IAA9) cluster separately. (A) PCA of the 480 significantly altered transcript levels between AS1 and wild-type lines at all three developmental stages (see Venn diagram in Figure 5). Changes during development allow discrimination of developmental stages, leading to three separated groups corresponding to bud (light-gray circle), anthesis (red and dark-gray circle), and postanthesis stages (green circle). (B) PCA of metabolite data. Wild-type samples clustered in two groups corresponding to bud/anthesis (gray) and postanthesis (black), while AS-IAA9 samples clustered into three groups corresponding to bud (yellow), anthesis (red), and postanthesis (green).
Figure 15.
Figure 15.
Model for Regulatory Events Underlying the Fruit Set Process in Tomato. IAA9 regulates the initiation of fruit set by establishing a spatial expression gradient whose release triggers the flower-to-fruit transition. Transcriptomic and metabolomic analysis reveal novel regulatory points in pathways associated with natural pollination fruit set and pollination-independent fruit set. The comparative analysis at the transcriptomic and metabolic levels of pollination-induced and fertilization-free fruit set identifies auxin and ethylene signaling as well as photosynthesis and sugar metabolism as major events of the fruit set program and potential components of the regulatory mechanism underlying this developmental process. The downregulation of MADS box transcription factors (TAG1 and TAGL6) also emerges as a key event of the fruit set process.

References

    1. Abel, S., Nguyen, M.D., and Theologis, A. (1995). The PS-IAA4/5-like family of early auxin-inducible mRNAs in Arabidopsis thaliana. J. Mol. Biol. 251 533–549. - PubMed
    1. Alba, R., Payton, P., Fei, Z., McQuinn, R., Debbie, P., Martin, G.B., Tanksley, S.D., and Giovannoni, J.J. (2005). Transcriptome and selected metabolite analyses reveal multiple points of ethylene control during tomato fruit development. Plant Cell 17 2954–2965. - PMC - PubMed
    1. Ampomah-Dwamena, C., Morris, B.A., Sutherland, P., Veit, B., and Yao, J.L. (2002). Down-regulation of TM29, a tomato SEPALLATA homolog, causes parthenocarpic fruit development and floral reversion. Plant Physiol. 130 605–617. - PMC - PubMed
    1. Arenas-Huertero, F., Arroyo, A., Zhou, L., Sheen, J., and Leon, P. (2000). Analysis of Arabidopsis glucose insensitive mutants, gin5 and gin6, reveals a central role of the plant hormone ABA in the regulation of plant vegetative development by sugar. Genes Dev. 14 2085–2096. - PMC - PubMed
    1. Baldet, P., Hernould, M., Laporte, F., Mounet, F., Just, D., Mouras, A., Chevalier, C., and Rothan, C. (2006). The expression of cell proliferation-related genes in early developing flowers is affected by a fruit load reduction in tomato plants. J. Exp. Bot. 57 961–970. - PubMed

Publication types

MeSH terms

LinkOut - more resources