

Vascular calcifications as a marker of increased cardiovascular risk: a meta-analysis
- PMID: 19436645
- PMCID: PMC2672434
- DOI: 10.2147/vhrm.s4822
Vascular calcifications as a marker of increased cardiovascular risk: a meta-analysis
Abstract
Background: Several imaging techniques may reveal calcification of the arterial wall or cardiac valves. Many studies indicate that the risk for cardiovascular disease is increased when calcification is present. Recent meta-analyses on coronary calcification and cardiovascular risk may be confounded by indication. Therefore, this meta-analysis was performed with extensive subgroup analysis to assess the overall cardiovascular risk of finding calcification in any arterial wall or cardiac valve when using different imaging techniques.
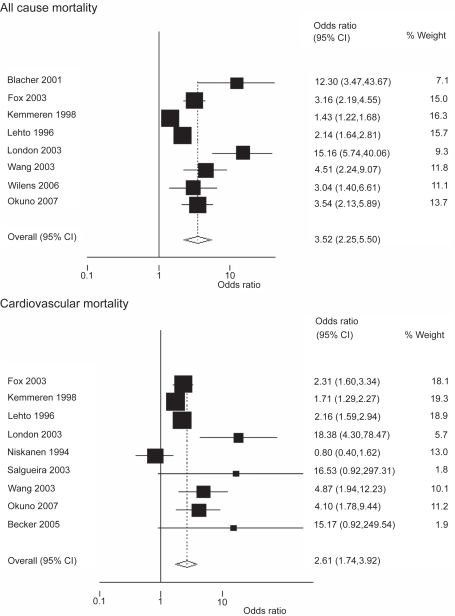
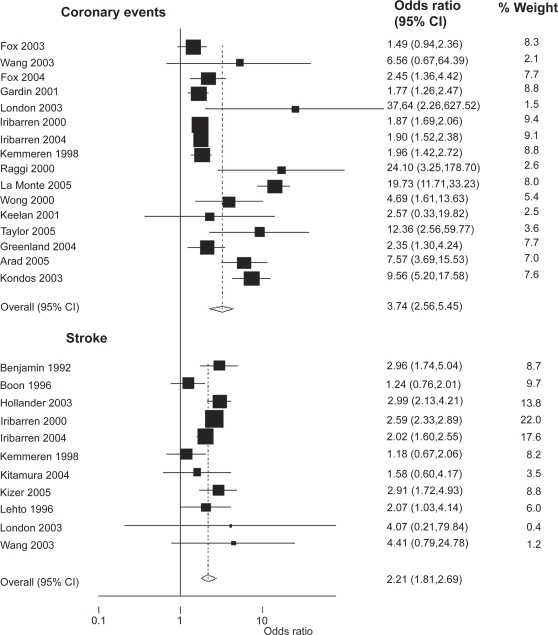
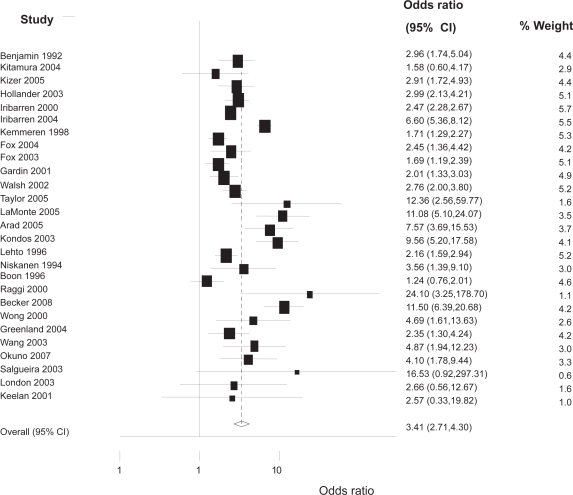
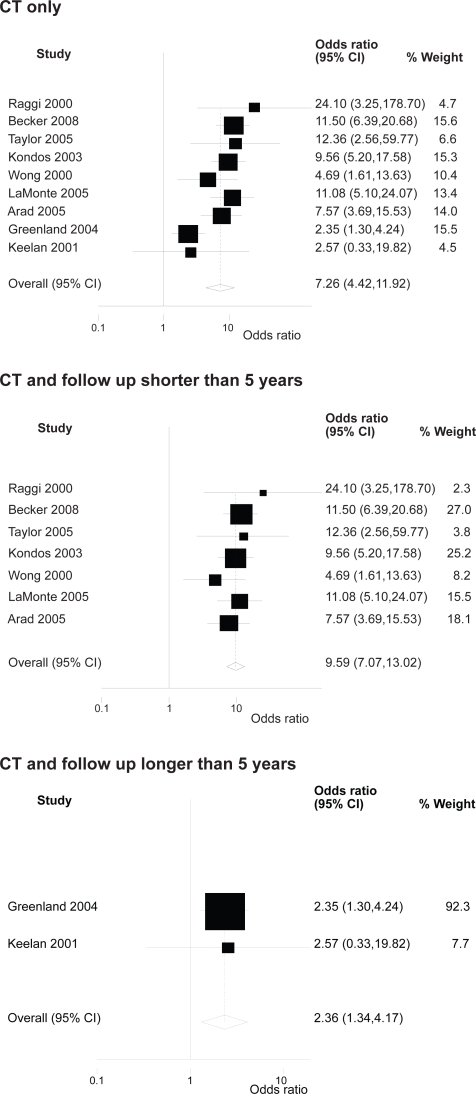
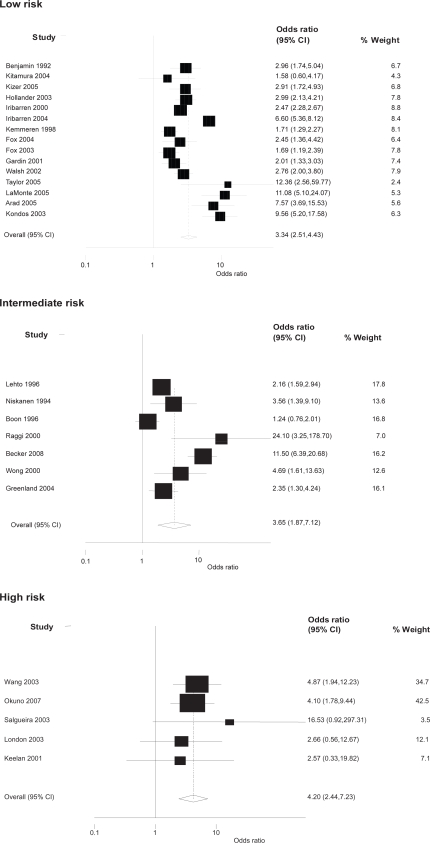
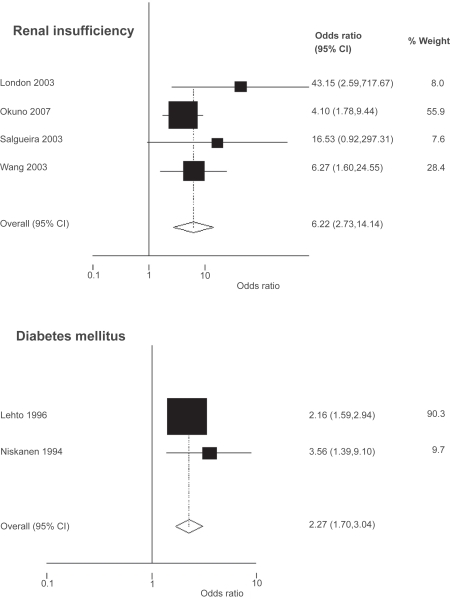
Methods and results: A meta-analysis of prospective studies reporting calcifications and cardiovascular end-points was performed. Thirty articles were selected. The overall odds ratios (95% confidence interval [CI]) for calcifications versus no calcifications in 218,080 subjects after a mean follow-up of 10.1 years amounted to 4.62 (CI 2.24 to 9.53) for all cause mortality, 3.94 (CI 2.39 to 6.50) for cardiovascular mortality, 3.74 (CI 2.56 to 5.45) for coronary events, 2.21 (CI 1.81 to 2.69) for stroke, and 3.41 (CI 2.71 to 4.30) for any cardiovascular event. Heterogeneity was largely explained by length of follow up and sort of imaging technique. Subgroup analysis of patients with end stage renal disease revealed a much higher odds ratio for any event of 6.22 (CI 2.73 to 14.14).
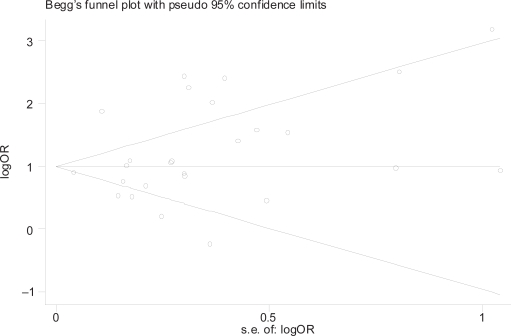
Conclusion: The presence of calcification in any arterial wall is associated with a 3-4-fold higher risk for mortality and cardiovascular events. Interpretation of the pooled estimates has to be done with caution because of heterogeneity across studies.
Keywords: calcification; cardiovascular risk; imaging; meta-analysis.
Figures
References
-
- Gidding SS, Bookstein LC, Chomka EV. Usefulness of electron beam tomography in adolescents and young adults with heterozygous familial hypercholesterolemia. Circulation. 1998;98:2580–2583. - PubMed
-
- Vliegenthart R, Hollander M, Breteler MMB, et al. Stroke is associated with coronary calcification as detected by electron-beam CT: The Rotterdam Coronary Calcification Study. Stroke. 2002;33:462–465. - PubMed
-
- Kondos GT, Hoff JA, Sevrukov A, et al. Electron-beam tomography coronary artery calcium and cardiac events: a 37-month follow-up of 5635 initially asymptomatic low- to intermediate-risk adults. Circulation. 2003;107:2571–2576. - PubMed
-
- Shaw LJ, Raggi P, Schisterman E, Berman DS, Callister TQ. Prognostic value of cardiac risk factors and coronary artery calcium screening for all-cause mortality. Radiology. 2003;228:826–833. - PubMed
-
- Iribarren C, Sidney S, Sternfeld B, Browner WS. Calcification of the aortic arch: risk factors and association with coronary heart disease, stroke, and peripheral vascular disease. JAMA. 2000;283:2810–2815. - PubMed
Publication types
MeSH terms
LinkOut - more resources
Full Text Sources
Other Literature Sources
Medical
