. 2009 May;5(5):e1000427.
doi: 10.1371/journal.ppat.1000427. Epub 2009 May 15.

Cytomegalovirus infection causes an increase of arterial blood pressure

Affiliations

Cytomegalovirus infection causes an increase of arterial blood pressure

Jilin Cheng et al. PLoS Pathog. 2009 May.

Abstract

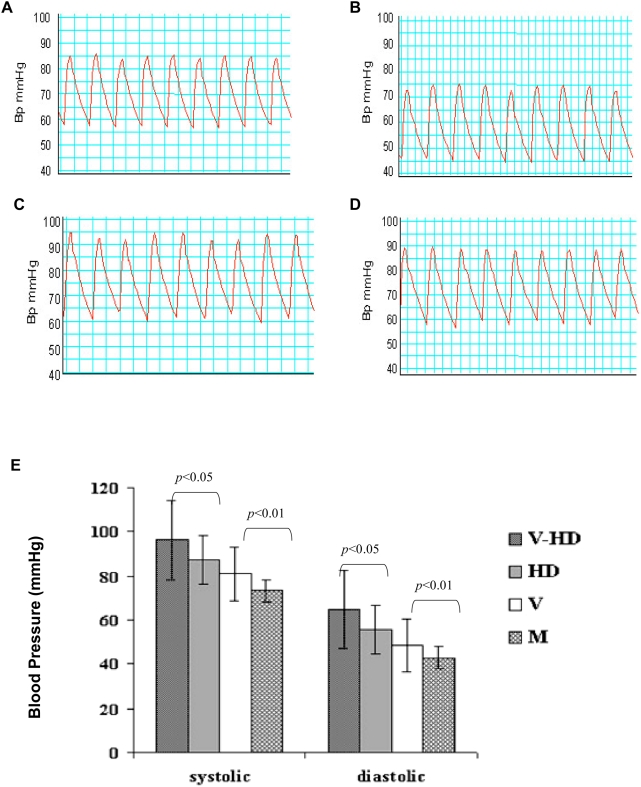
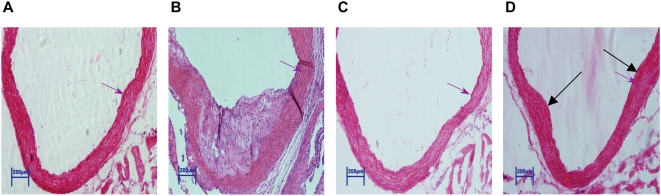
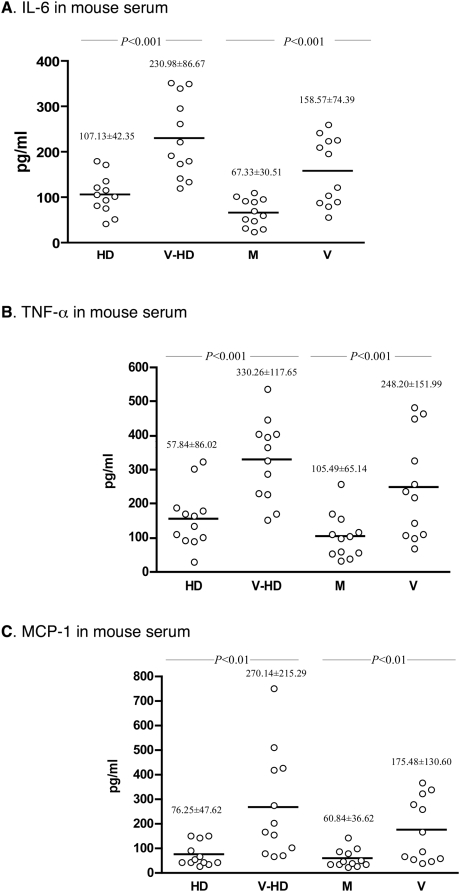
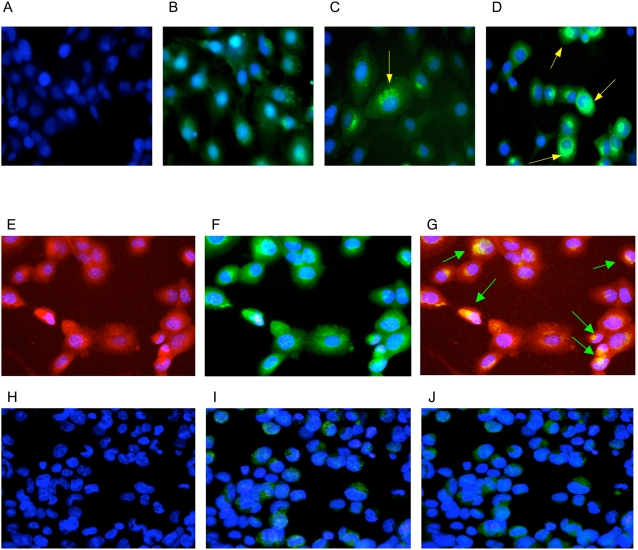
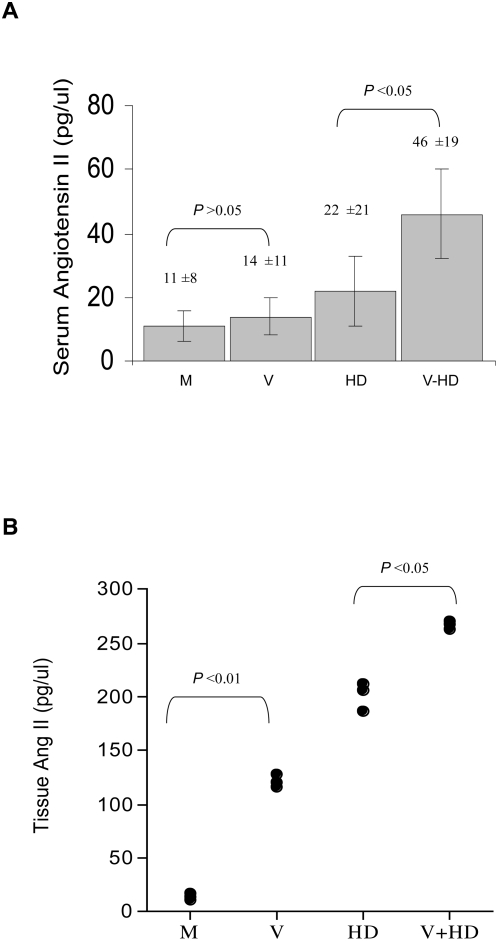
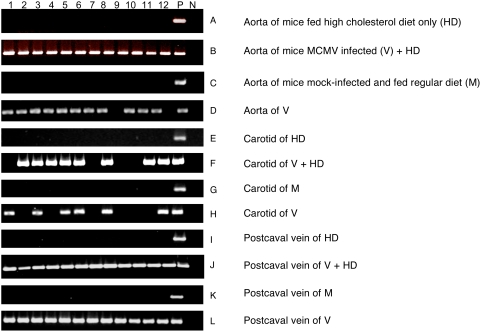
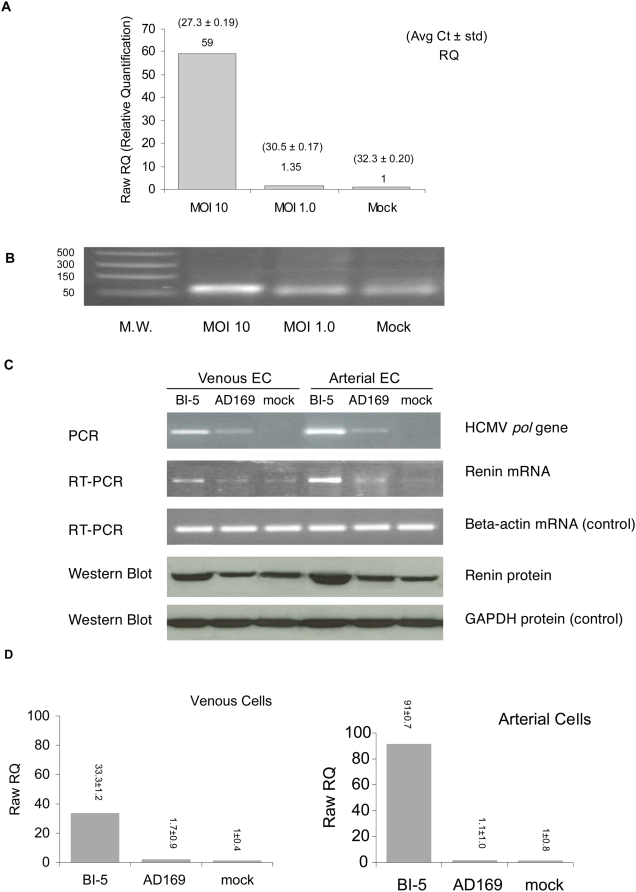
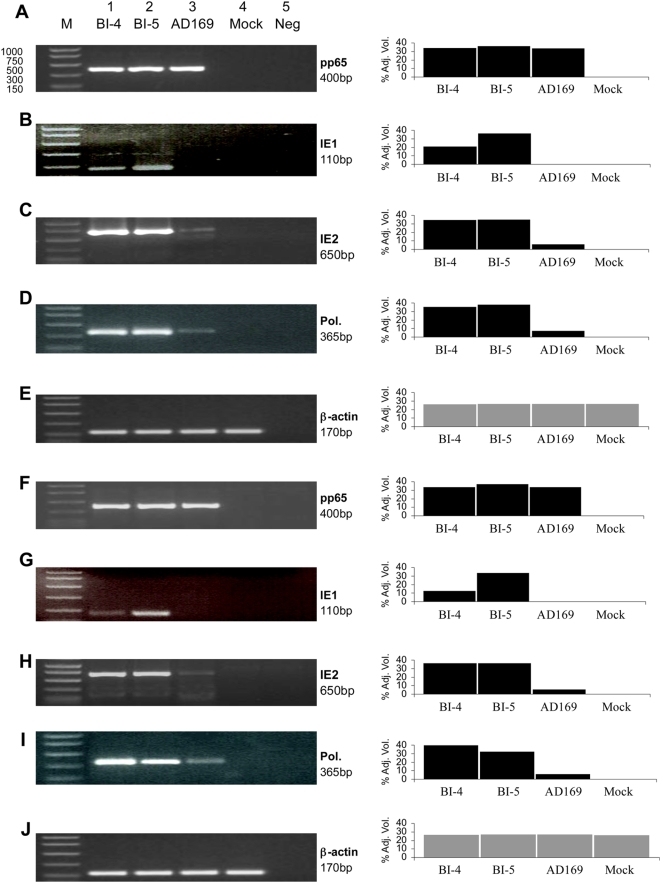
Cytomegalovirus (CMV) infection is a common infection in adults (seropositive 60-99% globally), and is associated with cardiovascular diseases, in line with risk factors such as hypertension and atherosclerosis. Several viral infections are linked to hypertension, including human herpes virus 8 (HHV-8) and HIV-1. The mechanisms of how viral infection contributes to hypertension or increased blood pressure are not defined. In this report, the role of CMV infection as a cause of increased blood pressure and in forming aortic atherosclerotic plaques is examined. Using in vivo mouse model and in vitro molecular biology analyses, we find that CMV infection alone caused a significant increase in arterial blood pressure (ABp) (p<0.01 approximately 0.05), measured by microtip catheter technique. This increase in blood pressure by mouse CMV (MCMV) was independent of atherosclerotic plaque formation in the aorta, defined by histological analyses. MCMV DNA was detected in blood vessel samples of viral infected mice but not in the control mice by nested PCR assay. MCMV significantly increased expression of pro-inflammatory cytokines IL-6, TNF-alpha, and MCP-1 in mouse serum by enzyme-linked immunosorbent assay (ELISA). Using quantitative real time reverse transcriptase PCR (Q-RT-PCR) and Western blot, we find that CMV stimulated expression of renin in mouse and human cells in an infectious dose-dependent manner. Co-staining and immunofluorescent microscopy analyses showed that MCMV infection stimulated renin expression at a single cell level. Further examination of angiotensin-II (Ang II) in mouse serum and arterial tissues with ELISA showed an increased expression of Ang II by MCMV infection. Consistent with the findings of the mouse trial, human CMV (HCMV) infection of blood vessel endothelial cells (EC) induced renin expression in a non-lytic infection manner. Viral replication kinetics and plaque formation assay showed that an active, CMV persistent infection in EC and expression of viral genes might underpin the molecular mechanism. These results show that CMV infection is a risk factor for increased arterial blood pressure, and is a co-factor in aortic atherosclerosis. Viral persistent infection of EC may underlie the mechanism. Control of CMV infection can be developed to restrict hypertension and atherosclerosis in the cardiovascular system.


Conflict of interest statement

The authors have declared that no competing interests exist.

Figures

Figure 1
Figure 1. Tracing blood pressures by carotid artery catheter.
A representative blood pressure tracing in a mouse from each assay group is shown (12 mice were in each group). (A) Mouse infected by MCMV. (B) Mock-infected. (C) Mouse infected by MCMV and fed a high cholesterol diet. (D) Mouse mock infected and fed a high cholesterol diet. (E) The mean value of ABp from each assay group (mmHg). V-HD: mice infected by MCMV and fed with a high cholesterol diet. HD: mice mock-infected and fed with a high cholesterol diet. V: mice infected by MCMV and fed with a regular diet. M: mice mock-infected and fed with a regular diet. Blood pressures in each group were measured at week 10 of experiment. The mean values of systolic and diastolic pressure were determined and calculated with Chart v4.1.2 software, respectively. Statistical significance between assay groups was determined with Student's t test. The base line blood pressure of a mouse from each assay group before MCMV infection is shown in Table S1.
Figure 2
Figure 2. An increase in blood pressure by MCMV infection is independent of atherosclerosis.
(A) Aortic root section from a mouse mock-infected and fed a high cholesterol diet showing no visible atherosclerosis. (B) Aortic root section from a mouse infected by MCMV plus fed a high cholesterol diet showing a typical atherosclerotic plaque with numerous foam cells and occasional cholesterol clefts. (C) Aortic root section from a mouse mock-infected and fed a regular diet showing no visible atherosclerosis. (D) Aortic root section from a mouse infected by MCMV and fed a regular diet showing intimal thickenings (arrow pointed) and no visible atherosclerosis. Each group contained 12 mice. All pictures were taken at 20× magnification, and scales are as shown in bar. The vessel wall was measured in the same position (red arrow pointed) of the aortic root of animals fed a high cholesterol diet alone (4 mm), MCMV infected plus fed on a high cholesterol diet (7 mm), fed a regular diet alone (3 mm), and MCMV infected plus fed on a regular diet (6 mm).
Figure 3
Figure 3. MCMV infection stimulated expression of pro-inflammatory cytokines in mouse serum.
The systemic changes on IL-6, TNF-α and MCP-1 levels in 4 experimental groups were determined by ELISA (each open circle represents a mouse). (A) IL-6 in mice infected with MCMV was significantly higher than in the mock-infected groups fed with either diet (P<0.001). (B) TNF-α level in mice infected with MCMV was significantly higher than in the mock-infected groups fed with either diet (P<0.001). (C) MCP-1 level in mice infected with MCMV was significantly higher than in the mock-infected groups fed with either diet (P<0.01). Statistical significance between assay groups was determined with Student's t test, and each group contained 12 mice.
Figure 4
Figure 4. MCMV infection induced expression of renin in a dose dependent manner.
(A) Antibody control. Cells were stained at day 6 post CMV infection at multiplicity of infection (MOI) = 10, with a non-specific IgG as the first antibody. (B) Mock infection control (MOI = 0). Cells were stained at day 6 post mock infection by renin specific IgG as the first antibody. Renin was detected at a low level, with positive fine granules suffused in the cytoplasm, as As4.1 cells have a basal level expression of renin from Ren-1c locus. (C) MCMV infection in a low dose (MOI = 1). Cells were stained at day 6 post infection. Renin positive granules were big, around the nucleus. (D) MCMV infection in a high dose (MOI = 10). Cells were stained at day 6 post infection, and renin positive granules were bigger and denser, surrounding the nucleus. (E–G) Co-staining of MCMV and renin. (E) MCMV antigens were stained in red with TRITC by anti-MCMV antibodies. (F) Renin was stained in green with FTIC by anti-renin antibodies. (G) Overlay the staining of TRITC and FTIC to show MCMV and renin co-localization in cells. The yellow spots, representing the co-stain of MCMV antigen and renin, surrounded the nucleus (arrow pointed). (H–J) Controls of immunofluorescent staining. (H) Mock-infected cells stained by anti-MCMV antibodies with TRITC, no MCMV antigen was detected. (I) Mock-infected cells stained by anti-renin antibody with FTIC, only basal level expression of renin was detected. (J) Overlay of TRITC and FTIC in mock-infected cells, and no MCMV antigen signal was detected.
Figure 5
Figure 5. MCMV infection increased Ang II level in mouse serum and artery tissues.
(A) MCMV infection increased angiotensin II (Ang II) level in mouse serum, and exacerbated the Ang II level induced by a high cholesterol diet. Each group contained 12 mice. (B) MCMV infection increased Ang II levels in aorta tissues, and exacerbated the Ang II level induced by a high cholesterol diet. Each dot represents a mouse from each assay group.
Figure 6
Figure 6. Detection of MCMV DNA in specimens of blood vessels.
The viral immediate early gene-1 (IE-1) DNA was detected in blood vessel tissues of mice infected by MCMV. No viral IE-1 was detected in mice mock-infected and fed with either diet. The nested-PCR assay used two pairs of viral specific primers that amplify the MCMV IE-1 gene into a 310-bp DNA fragment. (A–L) Lanes 1–12, the blood vessel tissues of twelve mice from each experimental group. P, PCR positive control; N, PCR negative control. The positive rates of MCMV IE-1 in blood vessels of MCMV infected mice are shown in Table 2.
Figure 7
Figure 7. HCMV infection of human EC induced expression of renin.
(A) HCMV infection induced expression of renin mRNA, determined by real time Q-RT-PCR assays. The expression of renin mRNA in cells showed correlation with an intensity of MOI 10>MOI 1, and cells with mock-infection (MOI 0) served as the base line (RQ = 1). (B) The products of Q-RT-PCR were confirmed by gel electrophoresis, showing that renin mRNA was highly expressed in cells infected with MOI 10, in contrast to the cells infected with MOI 1 and MOI 0 (mock infection). (C) HCMV infection induced renin expression in both venous (CRL-1730) and arterial (CRL-2472) EC, determined by PCR, RT-PCR and Western blot. To accurately measure the viral replication and renin expression, HCMV DNA polymerase (pol) gene and the renin mRNA levels in infected cells were determined by PCR and RT-PCR, respectively. Renin protein expressions were determined by Western blots in these cells. HCMV pol DNA was strongly detected in BI-5 (HCMV clinical isolate) infected venous and arterial cells. AD169, a lab strain known to be unable to grow in vascular endothelial cells, served as a viral infection control, which did not express viral pol gene nor induced renin expression. (D) HCMV BI-5 induced expression of renin mRNA in venous and arterial EC, determined by real time Q-RT-PCR assays.
Figure 8
Figure 8. Detection of HCMV ie1, ie2, pol, and pp65 mRNA in human EC.
The viral gene expression was determined by RT-PCR assays at 14 days post infection. The pp65 gene expression served as the control. (A–E) HCMV RNA expression in infected umbilical vein cells (CRL-1730). (F–J) HCMV RNA expression in abdominal aorta cells (CRL-2472). Data show that HCMV clinical isolates, BI-4 and BI-5, expressed viral specific genes and persistently infected EC, whereas HCMV lab strain, AD-169, did not. The RT-PCR products examined by agarose gel are shown on the left panel, and by densitometer tracing are shown on the right panel.

References

    1. Pass RF. Cytomegalovirus. In: Knipe DM, Howley PM, editors. Fields Virology. New York: Lippincott Williams & Wilkins. Vol. 2; 2001. pp. 2675–730.
    1. Peterslund NA. Herpesvirus infection: an overview of the clinical manifestations. Scand J Infect Dis (Suppl) 1991;80:15–20. - PubMed
    1. Takei H, Strong JP, Yutani C, Malcom GT. Comparison of coronary and aortic atherosclerosis in youth from Japan and the USA. Atherosclerosis. 2005;180:171–179. - PubMed
    1. Nascimento MM, Pecoits-Filho R, Lindholm B, Riella MC, Stenvinkel P. Inflammation, malnutrition and atherosclerosis in end-stage renal disease: a global perspective. Blood Purif. 2002;20:454–458. - PubMed
    1. Cool CD, Rai PR, Yeager ME, Hernandez-Saavedra D, Serls AE, et al. Expression of human herpesvirus 8 in primary pulmonary hypertension. N Engl J Med. 2003;349:1113–1122. - PubMed

Publication types

MeSH terms