. 2009 May;5(5):e1000432.
doi: 10.1371/journal.ppat.1000432. Epub 2009 May 15.

Genetic dissection of an exogenously induced biofilm in laboratory and clinical isolates of E. coli

Affiliations

Genetic dissection of an exogenously induced biofilm in laboratory and clinical isolates of E. coli

Sasan Amini et al. PLoS Pathog. 2009 May.

Abstract

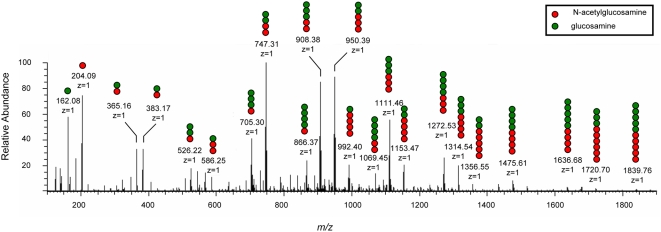
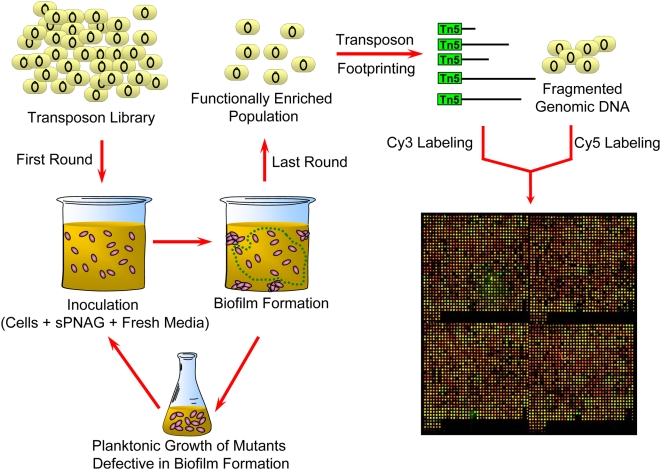
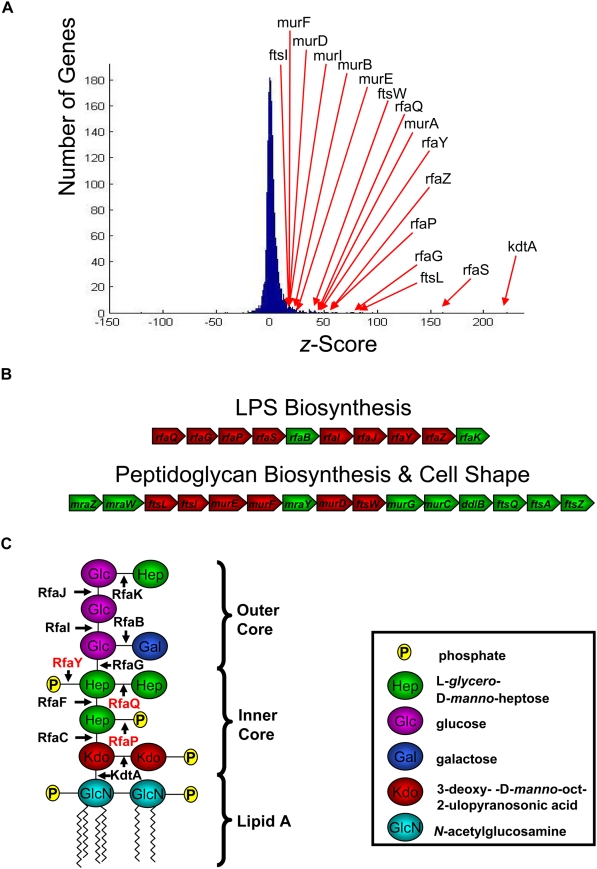
Microbial biofilms are a dominant feature of many human infections. However, developing effective strategies for controlling biofilms requires an understanding of the underlying biology well beyond what currently exists. Using a novel strategy, we have induced formation of a robust biofilm in Escherichia coli by utilizing an exogenous source of poly-N-acetylglucosamine (PNAG) polymer, a major virulence factor of many pathogens. Through microarray profiling of competitive selections, carried out in both transposon insertion and over-expression libraries, we have revealed the genetic basis of PNAG-based biofilm formation. Our observations reveal the dominance of electrostatic interactions between PNAG and surface structures such as lipopolysaccharides. We show that regulatory modulation of these surface structures has significant impact on biofilm formation behavior of the cell. Furthermore, the majority of clinical isolates which produced PNAG also showed the capacity to respond to the exogenously produced version of the polymer.


Conflict of interest statement

The authors have declared that no competing interests exist.

Figures

Figure 1
Figure 1. Secreted PNAG induces biofilm formation.
(i) Wild-type cells in LB+sPNAG. (ii) Wild-type cells in LB. (iii) ΔrfaY cells in LB+sPNAG. (iv) Wild-type cells in PBS. (v) Wild-type cells in PBS+.2%Glucose+sPNAG. (vi) Wild-type cells in PBS+.2% Lactose+sPNAG. (vii) ΔlacZ cells in PBS+sPNAG+lactose. In the experiments carried out in the presence of lactose, since there was no pre-induction phase with lactose, the observed cell density was lower.
Figure 2
Figure 2. ESI LTQ OrbiTrap mass spectrum of digested sPNAG, acquired in positive mode.
Purified sPNAG was digested with Dispersin B in water and analyzed by mass spectrometry after dialysis. For simplicity, only the most prominent peaks are labeled with their m/z and z values (where z is the charge). For each labeled peak, molecular composition was schematically illustrated by red and green circles representing acetylated and non-acetylated saccharide units, respectively (e.g., two red and three green circles corresponds to a pentamer with two N-acetylglucosamine and three glucosamine residues). For all identified molecules, the ion-pairs corresponding to the singly-charged protonated ions and their dehydration products were detected (e.g., 383.17 and 365.16). As shown in the figure, all prominent peaks correspond to a partially de-acetylated N-acetylglucosamine oligomer or the monomers. Almost all unlabeled peaks correspond to one member of some dehydrated-nondehydrated ion pairs, doubly charged versions of some of the expected molecules, or some adducts. A complete list of m/z values for all potential mono- and oligosaccharides species that could be generated from an incomplete digestion of a PNAG sample with all possible acetylation patterns is also given in Table S1, as a reference.
Figure 3
Figure 3. Schematic representation of the enrichment procedure for transposon mutants defective in sPNAG-based biofilm formation.
Figure 4
Figure 4. Genome-wide identification of loci involved in sPNAG-based biofilm formation.
(A) Distribution of z-scores after enrichment for mutants impaired in sPNAG-based biofilm formation. A transposon insertion mutant library of E. coli has been enriched for mutants that are defective in responding to sPNAG. To quantify the contribution of different loci to this phenotype, the insertion sites of the transposon in the enriched population were mapped using a microarray-based approach. The average signal acquired for each ORF on the microarray from two replicate experiments was used to calculate the z-score value for that ORF. This value reflects the relative abundance of transposon insertion events in the ORF (or in its vicinity) in the enriched population compared to the maximally diverse parental library. Distribution of these z-scores in the enriched population is illustrated by a histogram. Some of the ORFs which were significantly enriched were labeled on the histogram. More detailed information regarding the calculation of z-score is provided in Dataset S1. (B) Many of the transposon insertions with high z-scores in the first selection belonged to one of the two long gene clusters involved in LPS biosynthesis (top row) or regulation of cell shape and peptidoglycan biosynthesis (bottom row). ORFs with high z-scores in the selection are shown in red. (C) Structure of the major glycoform of E. coli K-12 LPS together with its biosynthetic genes (enzymes). The three genes (enzymes) whose deletion abolished sPNAG-based biofilm formation are highlighted in red.
Figure 5
Figure 5. Characterization of extra-genic suppressors reverting the biofilm formation defect of ΔrfaY cells in a transposon mutagenized library.
(A) Distribution of z-scores after enrichment for ΔrfaY double mutants that recovered the capacity for sPNAG-based biofilm formation. (B) Schematic representation of LPS structure, together with its biosynthesis genes (enzymes) in ΔrfaY cells. Secondary mutations which reverted the biofilm-formation deficiency of the ΔrfaY cells are highlighted in red. (C) LPS samples from a subset of ΔrfaY double mutants that recovered their ability to respond to sPNAG are separated on a SDS-PAGE gel. All double mutants showed truncated versions of LPS compared to the ΔrfaY cells. LPS samples from ΔrfaY ΔrfaC and ΔrfaY ΔrfaF cells were not detectible on the gel. (D) ΔrfaY cells, expressing RFP (mCherry), and ΔrfaY ΔrfaF cells, expressing GFP, were competed against each other for biofilm formation on a glass slide surface in presence of sPNAG (top row). Three images from left to right show the red channel, green channel, and the merged version. Similar results were obtained after swapping the fluorescent markers (bottom row).
Figure 6
Figure 6. Characterization of extra-genic suppressors reverting the biofilm formation defect of ΔrfaY cells in an over-expression library.
(A) Distribution of LPS biosynthesis genes were compared in the ΔrfaY transposon insertion and over-expression libraries. The microarray outputs of the ΔrfaY transposon insertion and the ΔrfaY over-expression libraries were sorted separately based on their z-score and divided into 10 equally populated bins. The number of genes belonging to lipopolysaccharide biosynthesis gene cluster (GO index GO:0009103) in each bin was counted and used to calculate hypergeometric p-value for over-representation of LPS biosynthesis genes in that bin for each library. Each bin was color-coded based on its −log10(p-value). The yellow color for a bin reflects statistically significant abundance of lipopolysaccharide biosynthesis genes in that bin. As shown, many LPS biosynthetic genes were found to be among the top 10% highly enriched category in the ΔrfaY background transposon insertion library, while in the over-expression library they belonged to the top 10% most depleted group. (B) LPS samples extracted from ΔrfaY pBR322-gadXYW and ΔrfaY cells and separated on SDS gels. (C) Transcription level of the rfaQ-K operon promoter is compared between ΔrfaY pBR322-gadWYX and ΔrfaY pBR322 cells by a β-galactosidase assay.
Figure 7
Figure 7. Antibiotic tolerance in sPNAG-based biofilms.
108 stationary phase wild-type cells were used to inoculate fresh LB in the presence (first and third column from left) or absence (second and fourth column) of 0.1 U/ml of sPNAG. After 12 hours, polymyxin B or ampicillin was added to a final concentration of 10 µg/ml and 100 µg/ml, respectively. After 18 hours, cells were pelleted down, washed with PBS three times, treated with Dispersin B to break the biofilm structures (if any), and plated for CFU determination. Independent experiments showed that Dispersin B treatment did not change the viability of the cells. For each column, results from ten independent samples were averaged and reported. Error bars indicate the standard error of the mean calculated from all independent measurements.

Similar articles

Cited by

References

    1. Hall-Stoodley L, Costerton JW, Stoodley P. Bacterial biofilms: from the natural environment to infectious diseases. Nat Rev Microbiol. 2004;2:95–108. - PubMed
    1. Fitzpatrick F, Humphreys H, O'Gara JP. The genetics of staphylococcal biofilm formation–will a greater understanding of pathogenesis lead to better management of device-related infection? Clin Microbiol Infect. 2005;11:967–973. - PubMed
    1. Itoh Y, Wang X, Hinnebusch BJ, Preston JF, 3rd, Romeo T. Depolymerization of beta-1,6-N-acetyl-D-glucosamine disrupts the integrity of diverse bacterial biofilms. J Bacteriol. 2005;187:382–387. - PMC - PubMed
    1. Izano EA, Sadovskaya I, Vinogradov E, Mulks MH, Velliyagounder K, et al. Poly-N-acetylglucosamine mediates biofilm formation and antibiotic resistance in Actinobacillus pleuropneumoniae. Microb Pathog. 2007;43:1–9. - PMC - PubMed
    1. Izano EA, Wang H, Ragunath C, Ramasubbu N, Kaplan JB. Detachment and killing of Aggregatibacter actinomycetemcomitans biofilms by dispersin B and SDS. J Dent Res. 2007;86:618–622. - PubMed

Publication types

MeSH terms

Substances