. 2009 May;5(5):e1000389.
doi: 10.1371/journal.pcbi.1000389. Epub 2009 May 15.

Molecular mechanics of the alpha-actinin rod domain: bending, torsional, and extensional behavior

Affiliations

Molecular mechanics of the alpha-actinin rod domain: bending, torsional, and extensional behavior

Javad Golji et al. PLoS Comput Biol. 2009 May.

Abstract

alpha-Actinin is an actin crosslinking molecule that can serve as a scaffold and maintain dynamic actin filament networks. As a crosslinker in the stressed cytoskeleton, alpha-actinin can retain conformation, function, and strength. alpha-Actinin has an actin binding domain and a calmodulin homology domain separated by a long rod domain. Using molecular dynamics and normal mode analysis, we suggest that the alpha-actinin rod domain has flexible terminal regions which can twist and extend under mechanical stress, yet has a highly rigid interior region stabilized by aromatic packing within each spectrin repeat, by electrostatic interactions between the spectrin repeats, and by strong salt bridges between its two anti-parallel monomers. By exploring the natural vibrations of the alpha-actinin rod domain and by conducting bending molecular dynamics simulations we also predict that bending of the rod domain is possible with minimal force. We introduce computational methods for analyzing the torsional strain of molecules using rotating constraints. Molecular dynamics extension of the alpha-actinin rod is also performed, demonstrating transduction of the unfolding forces across salt bridges to the associated monomer of the alpha-actinin rod domain.


Conflict of interest statement

The authors have declared that no competing interests exist.

Figures

Figure 1
Figure 1. The α-actinin structure.
A) α-actinin is a dimer with three major domains: an actin binding domain, a calmodulin homology domain, and a central rod domain. The monomers are arranged in an anti-parallel manner. B) VMD generated image of the α-actinin dimer rod domain. Each of the four spectrin repeats are colored according to conformation. R1 is colored in red, R2 in yellow, R3 in green, and R4 in blue. In dimer conformation R1 is interacting with R4 and R2 is interacting with R3.
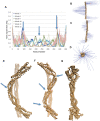
Figure 2
Figure 2. Normal mode analysis of the α-actinin monomer revealed bending and torsional natural frequencies.
A) RMSD of individual residues for six lowest vibrational modes. Natural movements consisted mainly of movement in the regions near the termini. Single-hinge bending modes are shown in blue colors, three-hinge bending modes in green colors, and the torsional mode is shown in pink. Arrows indicate location of hinges. B) Vector field representation of movements during one-hinge bending normal modes. Vector field representations show the direction and magnitude of movement of each residue in the molecule. Larger vectors represent larger movements. Mode 7 and mode 8 exhibited this type of bending motion. C) Vector field representation of movements during three-hinge bending modes. Mode 9, mode 10, and mode 12 showed three-hinge bending movement. D) Vector field representation of movement in the torsional mode. In the α-actinin monomer normal mode analysis only mode 11 showed torsional movement. E) Image captures movement characteristic of the single-hinge bending modes (7 and 8). Arrow points to location of the single-hinge. F) Image captures movement characteristic of the three-hinge bending modes (9, 10, and 12). Arrows point to location of the three hinges. G) Image showing the torsional movement in mode 11. Images were rendered using VMD . RMSD plots were created using WEBnm@ .
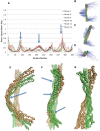
Figure 3
Figure 3. Natural frequencies of the α-actinin dimer.
Normal mode analysis using WEBnm@ on the α-actinin dimer revealed modes with bending, twisting, and both motions. A) Six lowest vibrational modes of the α-actinin dimer shown with RMSD analysis of individual residues. In all modes vibrations are seen mainly at the termini (near residues 1, residues 475, and residues 950). Plot of single-hinge bending modes are shown in blue colors, three-hinge bending and torsion modes shown in green colors, and torsional modes shown in red colors. Arrows indicate location of hinges. B) Vector field representation of bending vibrational motion in mode 7. C) Vector field representation of the simultaneous bending and twisting vibrations in modes 8, 10, and 11. D) Vector field representation of torsional vibrations seen in mode 9 and 12. E) VMD rendered image of the vibration in mode 7 characteristic of bending. Arrow points to single-hinge in bending mode. F) Bending and twisting motion, at the same time, shown here in a VMD representation. Modes 8,10, and 11 exhibit simultaneous bending and twisting. Arrows point to location of three hinges. G) The torsional motion of modes 9 and 12 captured in VMD. Most of the torsional natural vibration is at the termini.
Figure 4
Figure 4. Force induced bending of α-actinin.
Forced bending molecular dynamics simulations were carried out using CHARMm . A) Total bending forces ranging from 8 to 200 pN were applied to the α-actinin rod domain monomer. Forces less than 24 pN (8 pN shown in blue and 12 pN shown in red) failed to fully bend the monomer. The rate of bending is directly proportional to the total bending force. Trajectory for total force values of 24 pN shown in green, 48 pN shown in purple, 100 pN shown in blue, and 200 pN shown in orange. Graph shows angle between two termini and the central hinge throughout the simulation. B) Bending path of the α-actinin monomer. Successive steps were superimposed on the original conformation and represented using transparent material in VMD . Arrows indicate the direction of bending force applied to the ends of the rod. Triangle indicates location of hinge. C) Graph showing trajectory of bending simulations on the dimer conformation of the α-actinin rod domain. Forces show as: 24 pN is blue, 48 pN is red, 100 pN is green, and 200 pN is purple. Only forces of 100 pN and 200 pN achieved total bending. D) Trajectory of bending of the dimer conformation of the α-actinin rod domain. Successive steps from the bending simulation have been superimposed using VMD. Arrows indicate the direction of bending force applied to the ends of the rod. Triangle indicates location of hinge. E) Side view of fully bent dimer conformation superimposed on a transparent unbent α-actinin dimer. The bending results in two termini being side by side not on top of each other because of the 90-degree coiled-coil conformation. F) Index coloring representation of the α-actinin rod domain monomer. Terminus B (red) rotates underneath terminus A (blue) after bending is completed in a natural coiled-coil conformation.
Figure 5
Figure 5. Torque was applied at the termini of the α-actinin rod domain.
Α-actinin rod domain dimer shown with twisted monomer colored in orange and the other monomer colored in green. Constraints were placed on terminus B and terminus A. For rotations at terminus B, terminus A residues were constrained fixed while terminus B residues were constrained to rotate, and visa versa for rotation at terminus A. At terminus B (upper panel) constraints are placed on residues: 396 (light green), 397 (light pink), 398 (orange), 399 (gray), 400 (black), 401 (yellow), 469 (light blue-green), 470 (blue-green), 471 (light blue), 472 (dark blue), 473 (dark purple), 474 (light purple), 475 (dark pink). At terminus A (lower panel) constraints are placed on residues: 1 (red), 2 (black), 3 (orange), 4 (yellow), 5 (tan), 84 (light green), 85 (light blue-green), 86 (blue-green).
Figure 6
Figure 6. Torque profile of the α-actinin monomer and dimer.
Torsion was applied to the termini of both the α-actinin rod domain monomer (A–B) and dimer (C–D) using rotating constraints in NAMD . Torque was applied at both termini in both the clockwise and counterclockwise directions. A) Comparison of torque needed to rotate terminus A in the clockwise (green) and counterclockwise (purple) directions. The data is plotted using window averaging. Average of torque values in each 5-degree window is plotted with the standard error shown in error bars. Rotation beyond 140 degrees in the clockwise direction shows a significant increase in torque required as compared to counterclockwise rotation. B) Window averaged plot of the rotation of terminus B in either the clockwise (green) or counterclockwise (purple) directions. Clockwise rotation beyond 140 degrees required more torque than counterclockwise rotation. C) Window averaged plot of torque required to rotate the α-actinin rod domain dimer in the clockwise (blue) or counterclockwise (red) directions at terminus A. Clockwise rotation requires less torque than counterclockwise rotation because of steric interactions resulting from rotation of R1 in the counterclockwise direction. D) Torque required to rotate the α-actinin rod domain dimer at terminus B in either the clockwise (blue) or counterclockwise (red) directions. Rotation in either direction increases the total torque required, especially passed 150 degrees because of steric interaction with the complementary monomer.
Figure 7
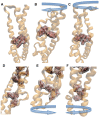
Figure 7. Aromatic packing stabilizes the spectrin repeats under torsion.
A) Surface representation of amino acid residues W381, Y417, and W453 near terminus B of a single α-actinin rod domain monomer. Aromatic packing between amino acid residues W381 and Y417 is seen. B) Effect of clockwise rotation of over 140 degrees on the aromatic packing between W381 and Y417. The aromatic packing is disrupted and torque required for continued rotation increases. C) Counterclockwise rotation at terminus B of the monomer conformation does not disrupt aromatic packing, shown here to be intact after rotation. D) More extensive aromatic packing exists at terminus A. Two sets of aromatic residues exist, each set sharing electrons within its members. Both sets are shown here with surface representation in VMD . E) Clockwise rotation of terminus A. Shown here, the aromatic packing in both sets are not completely disrupted, but electron sharing between F89, F74, and Y15 is reduced. F) Counterclockwise rotation of terminus A does not seem to disrupt the aromatic packing shown here as intact with the surface representation. Direction of rotation is indicated above each panel.
Figure 8
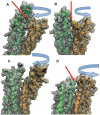
Figure 8. Steric interactions stabilize dimer in torsion simulations.
A) VMD rendered representation of the surface interactions (red arrow) at terminus B between the two monomers of the α-actinin rod domain after a 140-degree rotation in the clockwise direction. Steric interaction between the rotating monomer (orange) and the front surface of the other monomer (green) increase the torque required to continue rotation. B) Counterclockwise rotation at terminus B of the dimer conformation. Steric interactions occur (red arrow) after the rotation of one monomer (orange) around to the back surface of the other monomer (green). This steric interaction ends after about 170 degrees of rotation. C) Similar surface representation as in A and B but for Terminus A of the dimer conformation. One monomer (orange) is being rotated clockwise without any steric interactions. This is the only rotation of the dimer conformation that exhibits no steric interactions. D) Counterclockwise rotation at the Terminus A of the dimer. Steric interaction (red arrow) of the rotating monomer (orange) with the other monomer (green) occurs after only 60 degrees of rotation. Direction of rotation is indicated above each panel.
Figure 9
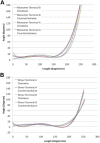
Figure 9. Distribution of torsion is localized to the termini of the molecule.
A) 4th order polynomial fit plot showing relationship between angle of rotation and distance from applied torque. Shown here is the torque applied to the dimer conformation at Terminus B (clockwise rotation in green, counterclockwise rotation in purple) and Terminus A (clockwise rotation in blue, counterclockwise rotation in red). Fixation constraints are placed at one terminus (the origin) and torsional constraints are placed at the other terminus (25 nm). Most of the rotation occurs locally near the terminus with the applied torque. B) Same plot as A for the rotation of the α-actinin dimer monomer. Clockwise rotation at Terminus B, shown in blue, clockwise rotation at Terminus A shown in green, counterclockwise rotation at Terminus B shown in red, and counterclockwise rotation at Terminus A shown in purple.
Figure 10
Figure 10. Dimerization increases the α-actinin rod domain rigidity especially in resilience to extensional forces.
Terminus B of a monomer alone, and a monomer in dimer conformation were extended using external force. Results suggest that single monomers (yellow 100 pN, orange 151 pN, and red 175 pN) extend with less force than monomers in a dimer complex (green). Forces up to 200 pN were unable to fully extend the dimer complex but forces of 150 pN fully extended the single monomers. Full extension is indicated by the pink dotted line. Simulations were run for 500 ps and validated with shorter explicit simulations.
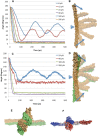
Figure 11
Figure 11. Extension of α-actinin monomer follows a trajectory dictated by the breaking of internal salt bridges.
A) Extension with a 100 pN force. The trajectory of the extension of the termini of α-actinin (monomer) is shown in dark blue. The cumulative extension due to salt bridge interactions is shown in orange. Notice the breaking of the salt bridges corresponds directly with increases in the rate of the overall extension. Trajectories of three salt bridges are captured here: T41 and E129 (light blue), E278 and K440 (purple), and E159 and R321 (red). Each successive extension of the α-actinin molecule specifically corresponds to the breaking of one of these salt bridges. B) Image showing the breaking of T41 and E129. C) Image showing the breaking of E278 and K440. D) Image showing the breaking of E159 and R321. E) α-actinin monomer with the three salt bridges represented intact.
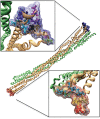
Figure 12
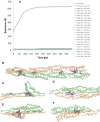
Figure 12. Extension of the α-actinin rod domain dimer.
Extension of the α-actinin rod domain dimer was stabilized by 22 specific charged interactions between the two monomers. A) Plot showing the extension of the α-actinin rod domain dimer under 150 pN. Unlike the extension of a single α-actinin monomer, the trajectory of the extension of the dimer was largely dictated by helical extension not by disruption of charged interactions. B) α-actinin rod domain dimer with the 22 charged interactions stabilizing the dimer represented. C) Image showing the extension of R1 during simulation. Although the second monomer (green) is not forced, it too extends due to the salt bridges. D) Extension of R2 and associated R3 (green) under simulation. E) Extension of R3 and associated R2 (green) under simulation. F) Extension of R4 at terminus B where the extensional force is applied. Notice the charged interactions remain intact causing extension of the other monomer.

Similar articles

Cited by

References

    1. Sjoblom B, Salmazo A, Djinovic-Carugo K. Alpha-actinin structure and regulation. Cell Mol Life Sci. 2008;65:2688–2701. - PMC - PubMed
    1. Blanchard A, Ohanian V, Critchley D. The structure and function of alpha-actinin. J Muscle Res Cell Motil. 1989;10:280–289. - PubMed
    1. Fraley TS, Pereira CB, Tran TC, Singleton C, Greenwood JA. Phosphoinositide binding regulates alpha-actinin dynamics: mechanism for modulating cytoskeletal remodeling. J Biol Chem. 2005;280:15479–15482. - PubMed
    1. Zhang W, Gunst SJ. Dynamic association between alpha-actinin and beta-integrin regulates contraction of canine tracheal smooth muscle. J Physiol. 2006;572:659–676. - PMC - PubMed
    1. Mukhina S, Wang YL, Murata-Hori M. Alpha-actinin is required for tightly regulated remodeling of the actin cortical network during cytokinesis. Dev Cell. 2007;13:554–565. - PMC - PubMed