

Reducing the activity and secretion of microbial antioxidants enhances the immunogenicity of BCG
- PMID: 19436730
- PMCID: PMC2677452
- DOI: 10.1371/journal.pone.0005531
Reducing the activity and secretion of microbial antioxidants enhances the immunogenicity of BCG
Abstract
Background: In early clinical studies, the live tuberculosis vaccine Mycobacterium bovis BCG exhibited 80% protective efficacy against pulmonary tuberculosis (TB). Although BCG still exhibits reliable protection against TB meningitis and miliary TB in early childhood it has become less reliable in protecting against pulmonary TB. During decades of in vitro cultivation BCG not only lost some genes due to deletions of regions of the chromosome but also underwent gene duplication and other mutations resulting in increased antioxidant production.
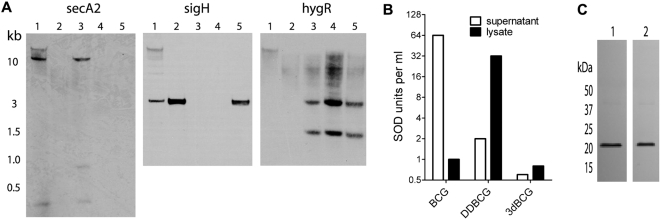
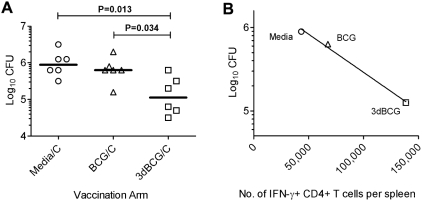
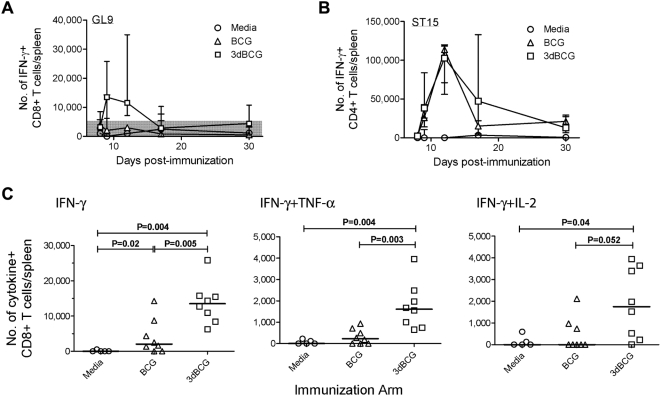
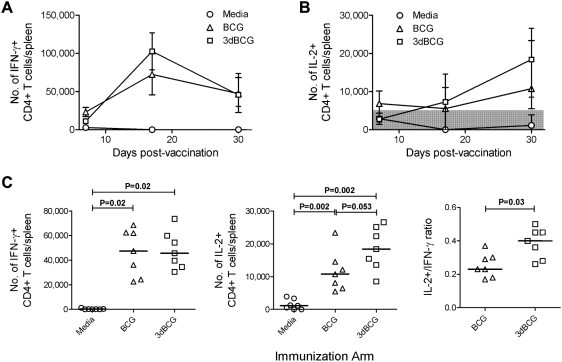
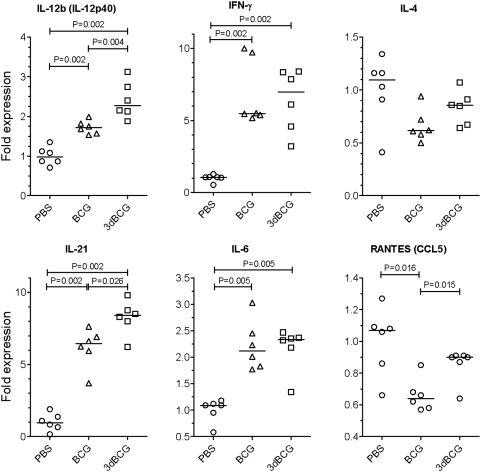
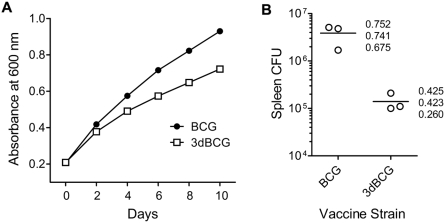
Methodology/principal findings: To determine whether microbial antioxidants influence vaccine immunogenicity, we eliminated duplicated alleles encoding the oxidative stress sigma factor SigH in BCG Tice and reduced the activity and secretion of iron co-factored superoxide dismutase. We then used assays of gene expression and flow cytometry with intracellular cytokine staining to compare BCG-specific immune responses in mice after vaccination with BCG Tice or the modified BCG vaccine. Compared to BCG, the modified vaccine induced greater IL-12p40, RANTES, and IL-21 mRNA in the spleens of mice at three days post-immunization, more cytokine-producing CD8+ lymphocytes at the peak of the primary immune response, and more IL-2-producing CD4+ lymphocytes during the memory phase. The modified vaccine also induced stronger secondary CD4+ lymphocyte responses and greater clearance of challenge bacilli.
Conclusions/significance: We conclude that antioxidants produced by BCG suppress host immune responses. These findings challenge the hypothesis that the failure of extensively cultivated BCG vaccines to prevent pulmonary tuberculosis is due to over-attenuation and suggest instead a new model in which BCG evolved to produce more immunity-suppressing antioxidants. By targeting these antioxidants it may be possible to restore BCG's ability to protect against pulmonary TB.
Conflict of interest statement
Figures

Similar articles
-
Heterologous Boost Following Mycobacterium bovis BCG Reduces the Late Persistent, Rather Than the Early Stage of Intranasal Tuberculosis Challenge Infection.Front Immunol. 2018 Oct 30;9:2439. doi: 10.3389/fimmu.2018.02439. eCollection 2018. Front Immunol. 2018. PMID: 30425711 Free PMC article.
-
Listeria-Vectored Multiantigenic Tuberculosis Vaccine Enhances Protective Immunity against Aerosol Challenge with Virulent Mycobacterium tuberculosis in BCG-Immunized C57BL/6 and BALB/c Mice.mBio. 2022 Jun 28;13(3):e0068722. doi: 10.1128/mbio.00687-22. Epub 2022 Jun 1. mBio. 2022. PMID: 35642945 Free PMC article.
-
Boosting BCG with recombinant influenza A virus tuberculosis vaccines increases pulmonary T cell responses but not protection against Mycobacterium tuberculosis infection.PLoS One. 2021 Nov 18;16(11):e0259829. doi: 10.1371/journal.pone.0259829. eCollection 2021. PLoS One. 2021. PMID: 34793507 Free PMC article.
-
[Novel vaccines against M. tuberculosis].Kekkaku. 2006 Dec;81(12):745-51. Kekkaku. 2006. PMID: 17240920 Review. Japanese.
-
Decrease in the effectiveness of Bacille Calmette-Guérin vaccine against pulmonary tuberculosis: a consequence of increased immune suppression by microbial antioxidants, not overattenuation.Clin Infect Dis. 2010 Jul 15;51(2):177-84. doi: 10.1086/653533. Clin Infect Dis. 2010. PMID: 20524854 Review.
Cited by
-
Preclinical testing of a vaccine candidate against tularemia.PLoS One. 2015 Apr 21;10(4):e0124326. doi: 10.1371/journal.pone.0124326. eCollection 2015. PLoS One. 2015. PMID: 25897786 Free PMC article.
-
A Modified Bacillus Calmette-Guérin (BCG) Vaccine with Reduced Activity of Antioxidants and Glutamine Synthetase Exhibits Enhanced Protection of Mice despite Diminished in Vivo Persistence.Vaccines (Basel). 2013 Jan 11;1(1):34-57. doi: 10.3390/vaccines1010034. Vaccines (Basel). 2013. PMID: 26343849 Free PMC article.
-
Recombinant BCG to Enhance Its Immunomodulatory Activities.Vaccines (Basel). 2022 May 23;10(5):827. doi: 10.3390/vaccines10050827. Vaccines (Basel). 2022. PMID: 35632582 Free PMC article. Review.
-
Transcriptional Response of Mycobacterium tuberculosis to Cigarette Smoke Condensate.Front Microbiol. 2021 Oct 15;12:744800. doi: 10.3389/fmicb.2021.744800. eCollection 2021. Front Microbiol. 2021. PMID: 34721344 Free PMC article.
-
Improving Mycobacterium bovis bacillus Calmette-Guèrin as a vaccine delivery vector for viral antigens by incorporation of glycolipid activators of NKT cells.PLoS One. 2014 Sep 25;9(9):e108383. doi: 10.1371/journal.pone.0108383. eCollection 2014. PLoS One. 2014. PMID: 25255287 Free PMC article.
References
-
- Forman HJ, Torres M. Signaling by the respiratory burst in macrophages. IUBMB Life. 2001;51:365–371. - PubMed
-
- Kantengwa S, Jornot L, Devenoges C, Nicod LP. Superoxide anions induce the maturation of human dendritic cells. Am J Respir Crit Care Med. 2003;167:431–437. - PubMed
-
- van der Veen RC, Dietlin TA, Karapetian A, Holland SM, Hofman FM. Extra-cellular superoxide promotes T cell expansion through inactivation of nitric oxide. J Neuroimmunol. 2004;153:183–189. - PubMed
-
- Edwards KM, Cynamon MH, Voladri RK, Hager CC, DeStefano MS, et al. Iron-cofactored superoxide dismutase inhibits host responses to Mycobacterium tuberculosis. Am J Respir Crit Care Med. 2001;164:2213–2219. - PubMed
-
- Braunstein M, Espinosa BJ, Chan J, Belisle JT, Jacobs WR., Jr SecA2 functions in the secretion of superoxide dismutase A and in the virulence of Mycobacterium tuberculosis. Mol Microbiol. 2003;48:453–464. - PubMed
Publication types
MeSH terms
Substances
Grants and funding
- T32 AI007474/AI/NIAID NIH HHS/United States
- R01 AI054540/AI/NIAID NIH HHS/United States
- P30 AI054999/AI/NIAID NIH HHS/United States
- AI-51561/AI/NIAID NIH HHS/United States
- R21 AI051561/AI/NIAID NIH HHS/United States
- P30 AI-54999/AI/NIAID NIH HHS/United States
- U54 AI057157/AI/NIAID NIH HHS/United States
- AI-54540/AI/NIAID NIH HHS/United States
- R01 AI051561/AI/NIAID NIH HHS/United States
- U54 AI 057157/AI/NIAID NIH HHS/United States
- R01 HL068518/HL/NHLBI NIH HHS/United States
- HL-68518/HL/NHLBI NIH HHS/United States
- T32 AI-007474/AI/NIAID NIH HHS/United States
LinkOut - more resources
Full Text Sources
Other Literature Sources
Medical
Research Materials
