. 2009 Sep 15;125(6):1306-15.
doi: 10.1002/ijc.24437.

ING2 is upregulated in colon cancer and increases invasion by enhanced MMP13 expression

Affiliations

ING2 is upregulated in colon cancer and increases invasion by enhanced MMP13 expression

Kensuke Kumamoto et al. Int J Cancer. .

Abstract

Inhibitor of growth 2 (ING2) is associated with chromatin remodeling and regulation of gene expression by binding to a methylated histone H3K4 residue and recruiting HDAC complexes to the region. The aim of our study is to investigate the regulation of ING2 expression and the clinical significance of upregulated ING2 in colon cancer. Here, we show that the ING2 mRNA level in colon cancer tissue increased to more than twice than that in normal mucosa in the 45% of colorectal cancer cases that we examined. A putative NF-kappaB binding site was found in the ING2 promoter region. We confirmed that NF-kappaB could bind to the ING2 promoter by EMSA and luciferase assays. Subsequent microarray analyses revealed that ING2 upregulates expression of matrix metalloproteinase 13 (MMP13), which enhances cancer invasion and metastasis. ING2 regulation of MMP13 expression was confirmed in both ING2 overexpression and knock down experiments. MMP13 expression was further induced by coexpression of ING2 with HDAC1 or with mSin3A, suggesting that the ING2-HDAC1-mSin3A complex members regulates expression of MMP13. In vitro invasion assay was performed to determine functional significance of ING2 upregulation. ING2 overexpressed cells exhibited greater invasive potential. Taken together, upregulation of ING2 was associated with colon cancer and MMP13-dependent cellular invasion, indicating that ING2 expression might be involved with cancer invasion and metastasis.


Figures

Figure 1
Figure 1
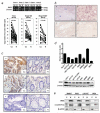
ING2 mRNA is upregulated in colon cancer. (a) Upper panel, RT-PCR analysis of ING2 mRNA in 5 colon cancer samples, which were purchased from BD Bioscience. β-actin was used as the internal control. Lower panel, Results of real-time RT-PCR analyses of ING2 mRNA levels of in 34 human colon cancer tissues and corresponding nonmalignant mucosa. Cancerous tissues (Ca) and nonmalignant mucosa (N) were pre-pared from the same patient. Paired t test was performed to ascertain statistical significance between the amount in cancer tissue and in nonmalignant mucosa. The ING2 and β-actin expression vector were used for calculating the copy number. Y-axis shows the copy number of ING2 per 10,000 copies of β-actin. (b) Representative staining of ING2 mRNA by in situ hybridization in human colon cancer tissues (a, b and d) and nonmalignant mucosa (c). (a) included both cancerous tissues (Ca) and nonmalignant mucosa (N). The anti-sense probe (a, b and c) or sense probe (d) were used for detecting the ING2 mRNA transcripts. Bar, 200 μm (a), 100 μm (b,c and d).(c) Typical examples of immunohistochemical localization of ING2 in colon cancer cells and surrounding nonmalignant colonic epithelia. ×40; H&E staining. The cases with upregulated ING2 mRNA in cancer tissues (a and b) and the case with no alteration of ING2 mRNA level was seen between cancer tissues and normal tissues (c). Ca, cancer cells; N, nonmalignant colonic epithelial cells. (d) Upper panel, RT-PCR analysis of ING2 mRNA in 8 colon cancer cell lines. The ING2 expression was normalized by β-actin. Lower panel, ING2 protein expression was determined by western blotting using total cell lysates prepared from 8 colon cancer cell lines. Thirty-five μg were applied for the gel. (e) The distribution of ING2 protein in colon cancer cells was observed by western blotting. α-lamin A/C and β-actin were used as control of nuclear fractions and cytoplasmic cell fractions, respectively. C, cytoplasm; N, nuclear extracts.
Figure 2
Figure 2
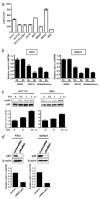
NF-κB activation positively regulates ING2 expression. (a) NF-κB binding activity of colon cancer cell lines was measured using NF-κB, p65 ELISA kit. Chemiluminescent results were detected using a luminometer. Columns, average of 3 independent experiments; Bars, SD. (b) The ING2 mRNA expression in RKO and SW837 cells, which were treated with either 2.5 μM MG132 or 100 μM wedelolactone or DMSO for 3 and 6 hr, was analyzed by realtime RT-PCR. β-actin mRNA transcripts were used as a internal control. (c) Upper panel, Phospho-p65 and p65 expression was determined by western blotting in HCT116 and WiDr cells, which were treated with 3 μM doxorubicin for 0.5, 1 and 2 hr. Lower panel, Realtime RT-PCR was performed for detecting the ING2 mRNA expression in HCT116 and WiDr cells, which were treated with 3 μM doxorubicin for 6 and 12 hr. The ING2 mRNA level was normalized using β-actin mRNA transcripts. Columns, average of 3 independent experiments; Bars, SD. (d) Upper panel, Knockdown of p65 expression was performed by siRNA technology. RKO and SW837 cells were treated with the oligonucleotides for siRNA experiments (p65 siRNA). Cells were transfected with 40 nM of siRNA and incubated for 72 hr. A random sequence control (control siRNA) was used as a control. p65 expression was determined by western blotting. β-actin was probed as an internal control. Lower panel, Realtime RT-PCR was performed for detecting ING2 mRNA transcripts using the same samples as used for the upper panel experiment. ING2 expression was normalized by β-actin mRNA transcripts. Columns, average of 3 independent experiments; Bars, SD.
Figure 3
Figure 3
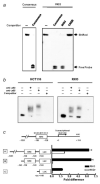
NF-κB bounds to ING2 promoter and regulates ING2 expression. (a) Electrophoretic mobility-shift assay (EMSA) was carried out using biotinated oligonucleotides generated from NF-κB consensus DNA-binding sequence (consensus) and the candidate of NF-κB consensus DNA-binding sequence on the ING2 regulatory region (ING2). Recombinant p50 were used for detecting a shifted band. Each unlabeled oligonucleotides (100-fold excess), which were described in the Material and Methods section, was used as a competitor. (b) The biotinated oligonucleotides of the consensus NF-κB sequence in the ING2 regulatory region was analyzed for the ability to form a super-shifted complex with DNA binding proteins in nuclear extracts from HCT116 and RKO cells. Anti-p50 and anti-p65 antibodies were incubated with the nuclear extracts. Unlabeled oligonucleotides (100-fold excess) of the consensus NF-κB sequence in the ING2 regulatory region was used as a competitor. (c) Three kinds of luciferase constructs using pGL-3 basic vector were designed as A, B and C. Each 1.6 μg of a pGL-3 luciferase reporter and 0.16 μg of Renilla luciferase assay vector pRL were cotransfected into RKO and WiDr cells. The firefly luciferase activity was measured and normalized by Renilla luciferase activity, 24 hr later. Columns, Average of relative luciferase activity in 3 independent experiments; bars, SD.
Figure 4
Figure 4
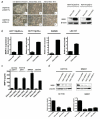
The ING2 expression is positively associated with the MMP13 expression. (a) Left, ING2 protein expression in adeno-GFP or adeno-ING2 infected HCT116 cells was determined by western blotting. β-actin was probed as an internal control. Right, Microscopic photographs of HCT116 p53+/+ (a, b and c) and p53-/- (d, e and f) infected with adeno-ING2 (10MOI) for 24 hr (b and e) and 48 hr (c and f). a and d showed the cells before the infection. (b) The MMP13 mRNA transcripts in ING2 overexpressing cells were analyzed by realtime RT-PCR. Adeno-ING2 or adeno-GFP were exposed to the colon cancer cell lines, HCT116 p53+/+ (10MOI), HCT116 p53-/- (10MOI), SW620 (20MOI) and LS174T (50MOI) for 48 hr. The expression was normalized by β-actin mRNA transcripts. Columns, average of 3 independent experiments; Bars, SD. (c) MMP13 protein level was determined by ELISA. The supernatants were collected from the cell treated with adeno-ING2 or adeno-GFP. Columns, average of 3 independent experiments; Bars, SD. (d) Upper panel, Knockdown of ING2 expression was performed by siRNA technology. HCT116 and SW837 cells were treated with 3 different oligonucleotides for siRNA experiments (ING2 siRNA 1, 2 and 3). Cells were transfected with 40 nM of siRNA and incubated for 72 hr. A random sequence control (ING2 siRNA—control) was used as a control. ING2 expression was determined by western blotting. β-actin was probed as an internal control. Lower panel, Realtime RT-PCR was performed for detecting MMP13 mRNA transcripts using the same samples as earlier. MMP13 expression was normalized by β-actin mRNA transcripts. Columns, average of 3 independent experiments; Bars, SD. [Color figure can be viewed in the online issue, which is available at www.interscience.wiley.com.]
Figure 5
Figure 5
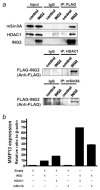
MMP13 expression is enhanced by the combination of ING2 with either HDAC1 or mSin3A. (a) Immunoprecipitation (IP) was performed using anti-FLAG, anti-HDAC1, or anti-mSin3A antibody for confirming a previously reported physical association between ING2, HDAC1 and mSin3A. Cell lysate was prepared from 293 cells, to which FLAG-ING2 vector was transfected and incubated for 48 hr. (b) MMP13 mRNA expression was analyzed by realtime RT-PCR. The indicated amount of each vector was transfected to 293 cells using the Lipofectamine 2000 following manufacturer’s protocol. Cells were harvested at 48 hr posttransfection. MMP13 expression was normalized by β-actin mRNA transcripts. Columns, average of 3 independent experiments; Bars, SD.
Figure 6
Figure 6
MMP13 expression is correlated with ING2 expression. Both ING2 and MMP13 mRNA levels in colon cancer tissue were determined by realtime RT-PCR. The colon cancer samples were same with Figure 1b. Both ING2 and MMP13 expression were normalized by β-actin mRNA transcripts. Pearson’s correlation analysis was performed.
Figure 7
Figure 7
MMP13 expression is associated with tumor invasion. Using the HCT116 cells infected with adenoviral constructs expression either GFP or ING2 described in Figure 3, a cell invasion assay was performed using a 24-well BD BioCoat Tumor Invasion System as described in Material and Methods. Statistical analysis was performed by Student’s t-test. Columns, average of 3 independent experiments; Bars, SD.

Similar articles

Cited by

References

    1. Jemal A, Siegel R, Ward E, Hao Y, Xu J, Murray T, Thun MJ. Cancer statistics, 2008. CA Cancer. J Clin. 2008;58:71–96. - PubMed
    1. Shimada Y, Saito A, Suzuki M, Takahashi E, Horie M. Cloning of a novel gene (ING1L) homologous to ING1, a candidate tumor suppressor. Cytogenet Cell Genet. 1998;83:232–5. - PubMed
    1. Garkavtsev I, Kazarov A, Gudkov A, Riabowol K. Suppression of the novel growth inhibitor p33ING1 promotes neoplastic transformation. Nat Genet. 1996;14:415–20. - PubMed
    1. Garkavtsev I, Grigorian IA, Ossovskaya VS, Chernov MV, Chumakov PM, Gudkov AV. The candidate tumour suppressor p33ING1 cooperates with p53 in cell growth control. Nature. 1998;391:295–8. - PubMed
    1. Feng X, Hara Y, Riabowol K. Different HATS of the ING1 gene family. Trends Cell Biol. 2002;12:532–8. - PubMed

Publication types

MeSH terms