. 2009 Sep;11(9):1340-53.
doi: 10.1111/j.1462-5822.2009.01334.x. Epub 2009 Apr 30.

Deformability limits of Plasmodium falciparum-infected red blood cells

Affiliations
Free PMC article

Deformability limits of Plasmodium falciparum-infected red blood cells

Thurston Herricks et al. Cell Microbiol. 2009 Sep.
Free PMC article

Abstract

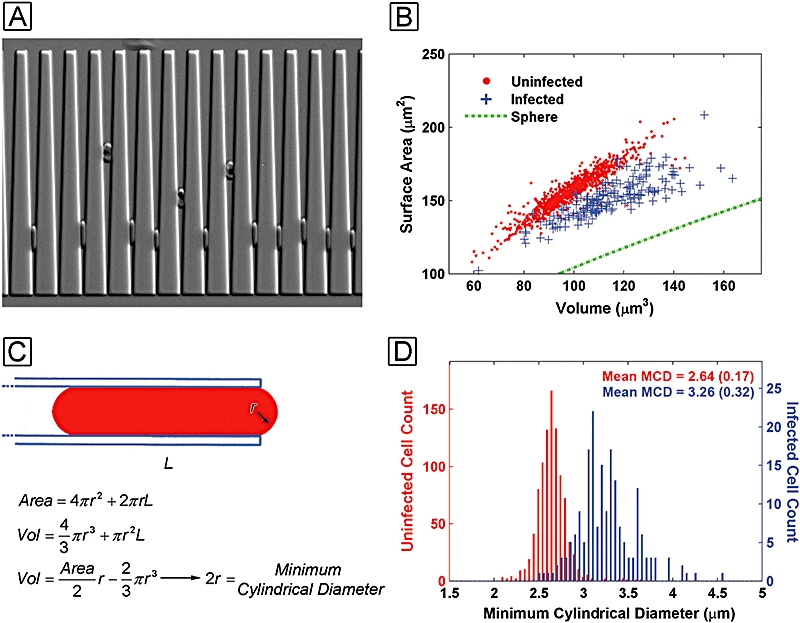
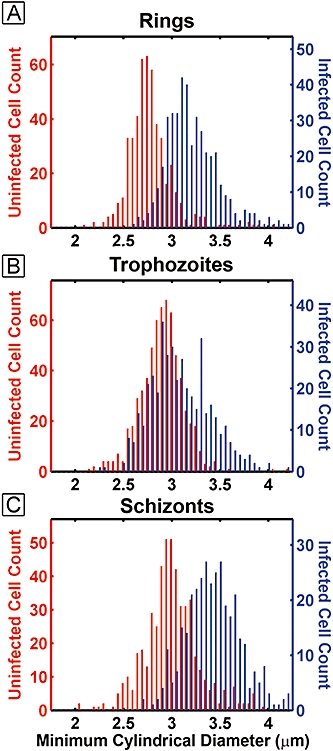
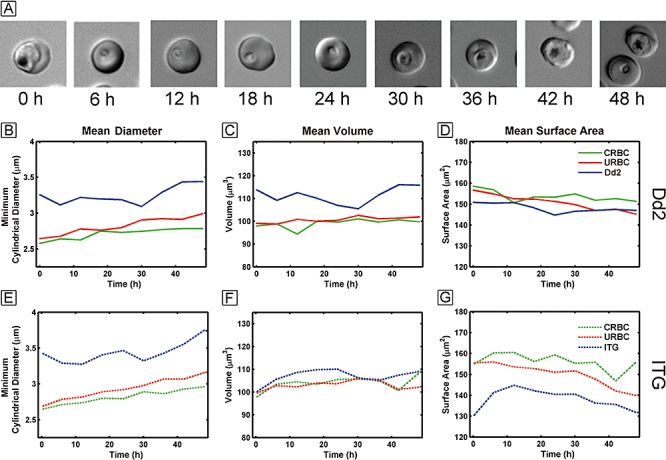
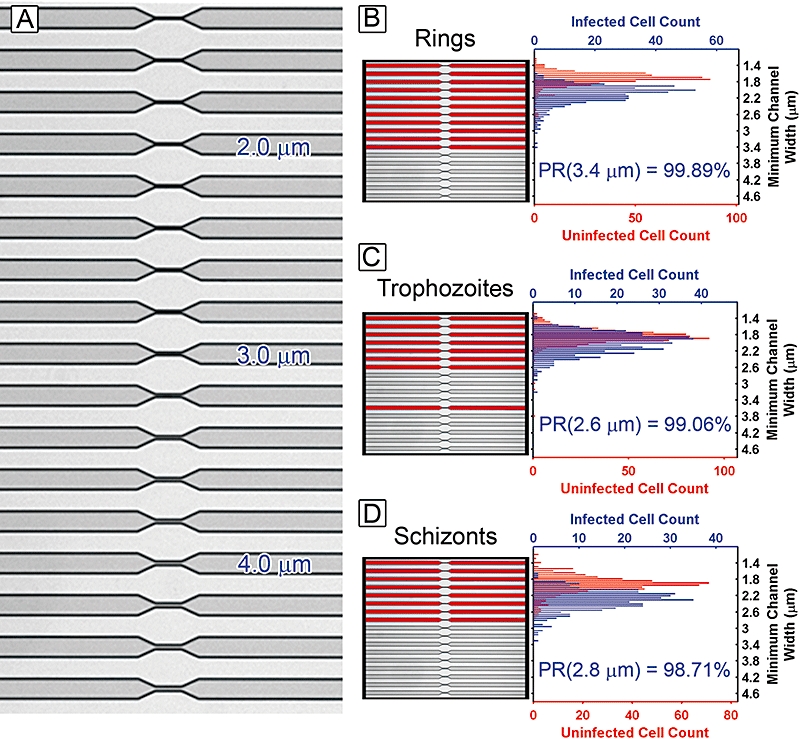
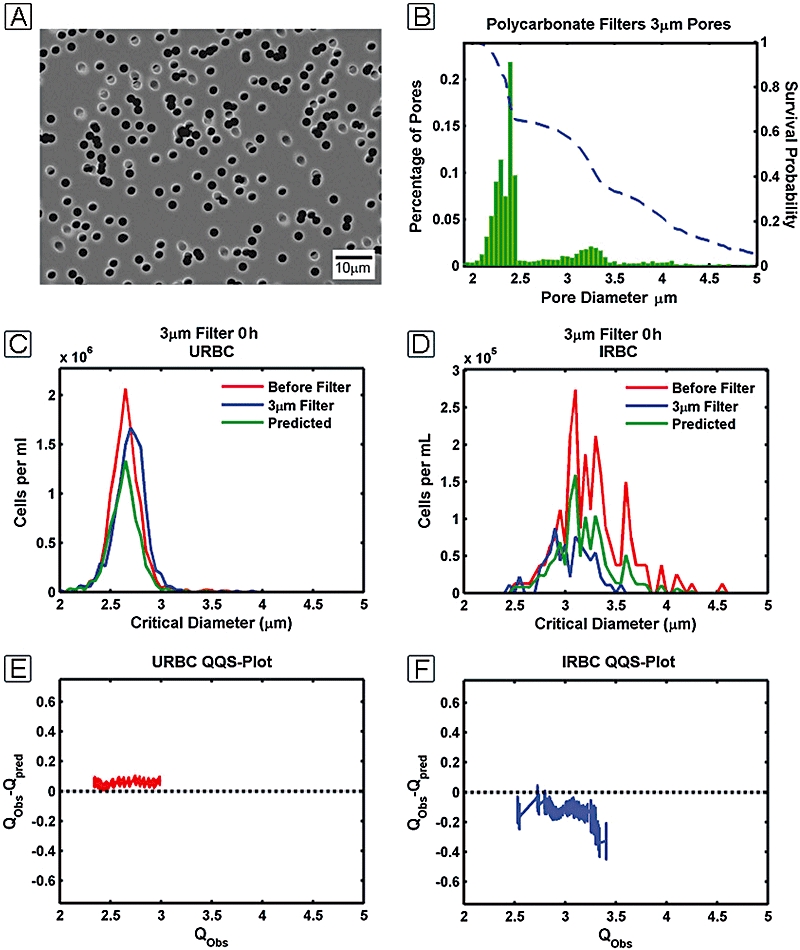
Splenic filtration of infected red blood cells (RBCs) may contribute to innate immunity and variable outcomes of malaria infections. We show that filterability of individual RBCs is well predicted by the minimum cylindrical diameter (MCD) which is calculated from a RBC's surface area and volume. The MCD describes the smallest diameter tube or smallest pore that a cell may fit through without increasing its surface area. A microfluidic device was developed to measure the MCD from thousands of individual infected RBCs (IRBCs) and uninfected RBCs (URBCs). Average MCD changes during the blood-stage cycle of Plasmodium falciparum were tracked for the cytoadherent strain ITG and the knobless strain Dd2. The MCD values for IRBCs and URBCs raise several new intriguing insights into how the spleen may remove IRBCs: some early-stage ring-IRBCs, and not just late-stage schizont-IRBCs, may be highly susceptible to filtration. In addition, knobby parasites may limit surface area expansions and thus confer high MCDs on IRBCs. Finally, URBCs, in culture with IRBCs, show higher surface area loss which makes them more susceptible to filtration than naive URBCs. These findings raise important basic questions about the variable pathology of malaria infections and metabolic process that affect volume and surface area of IRBCs.


Figures

Fig. 1
Fig. 1
A. Schizont-IRBCs can easily be distinguished over the URBCs by the haem pigment. B. When measurements are made on roughly 1000 schizont-IRBCs and URBCs a surface area and volume scatter plot are generated to show a clear separation between the two cell populations. C. The MCD is found by solving a polynomial expression. D. A histogram of IRBCs and URBCs critical diameters shows that the IRBCs have mean MCD larger than that of the URBCs with the standard deviation of the population given in parentheses.
Fig. 2
Fig. 2
Histograms of critical diameters comparing co-cultured URBCs and IRBCs as they progress from ring (A) to trophozoites (B) and finally schizont (C). The trophozoite-infected MCD shows the greatest amount of overlap with the URBC MCD distribution. IRBCs are shown as the blue bars and URBCs are shown in red.
Fig. 3
Fig. 3
A. DIC images of parasites over the 48 h time-course. B–G. The mean diameter for Dd2 and ITG (B and E), the mean volume (C and F) and the mean surface area (D and G) are plotted for control-RBCs (green), IRBCs (blue) and URBCs (red) over the 48 h time-course.
Fig. 4
Fig. 4
Channel constrictions with widths that range from 1.4 to 4.6 μm (A). Parasite cultures flowed through the constrictions at an applied pressure drop of 2.0 kPa for approximately 2 min. The channels shown in red had IRBCs or URBCs which blocked flow for each stage of rings (B), trophozoites (C) and schizonts (D). The width of the largest blocked channel had a percentile rank (PR) in the MCW histograms of 98–99% indicating that 1–2% of the cell in the culture had a MCW larger than that of the largest blocked channel.
Fig. 5
Fig. 5
Cultures were passed through polycarbonate membrane filters (A) with a pore diameter distribution measured in the SEM (B). The blue line in (B) is the survival probability function of the filter calculated from the pore diameter distribution. The survival probability function was used to generate a predicted population distribution (C and D). The QQS plots for the URBCs (E) and IRBCs (F) are generated by plotting the quantiles of the observed distribution (Qobs) versus the difference between the quantiles of the predicted distribution and the observed distributions (QobsQpred) for the respective IRBC and URBC populations.

Similar articles

Cited by

References

    1. Antia M, Herricks T, Rathod PK. Microfluidic modeling of cell–cell interactions in malaria pathogenesis. PLoS Pathog. 2007;3:e99. - PMC - PubMed
    1. Areekul S, Yamarat P. Alterations in the viscosity and deformability of red cells in patients with Plasmodium falciparum. J Med Assoc Thai. 1988;71:196–202. - PubMed
    1. Bannister LH, Hopkins JM, Margos G, Dluzewski AR, Mitchell GH. Three-dimensional ultrastructure of the ring stage of Plasmodium falciparum: evidence for export pathways. Microsc Microanal. 2004;10:551–562. - PubMed
    1. Baruch DI, Gormely JA, Ma C, Howard RJ, Pasloske BL. Plasmodium falciparum erythrocyte membrane protein 1 is a parasitized erythrocyte receptor for adherence to CD36, thrombospondin, and intercellular adhesion molecule 1. Proc Natl Acad Sci USA. 1996;93:3497–3502. - PMC - PubMed
    1. Baruch DI, Ma XC, Pasloske B, Howard RJ, Miller LH. CD36 peptides that block cytoadherence define the CD36 binding region for Plasmodium falciparum-infected erythrocytes. Blood. 1999;94:2121–2127. - PubMed

Publication types

LinkOut - more resources