

Experimental study of the behavioural mechanisms underlying self-organization in human crowds
- PMID: 19439442
- PMCID: PMC2839952
- DOI: 10.1098/rspb.2009.0405
Experimental study of the behavioural mechanisms underlying self-organization in human crowds
Abstract
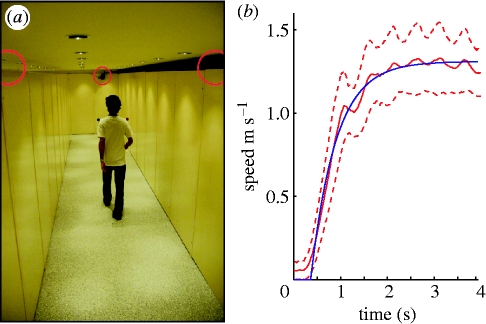
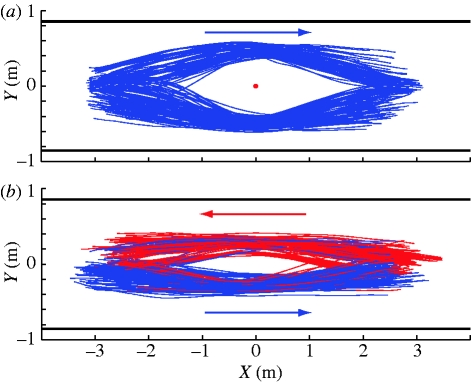
In animal societies as well as in human crowds, many observed collective behaviours result from self-organized processes based on local interactions among individuals. However, models of crowd dynamics are still lacking a systematic individual-level experimental verification, and the local mechanisms underlying the formation of collective patterns are not yet known in detail. We have conducted a set of well-controlled experiments with pedestrians performing simple avoidance tasks in order to determine the laws ruling their behaviour during interactions. The analysis of the large trajectory dataset was used to compute a behavioural map that describes the average change of the direction and speed of a pedestrian for various interaction distances and angles. The experimental results reveal features of the decision process when pedestrians choose the side on which they evade, and show a side preference that is amplified by mutual interactions. The predictions of a binary interaction model based on the above findings were then compared with bidirectional flows of people recorded in a crowded street. Simulations generate two asymmetric lanes with opposite directions of motion, in quantitative agreement with our empirical observations. The knowledge of pedestrian behavioural laws is an important step ahead in the understanding of the underlying dynamics of crowd behaviour and allows for reliable predictions of collective pedestrian movements under natural conditions.
Figures
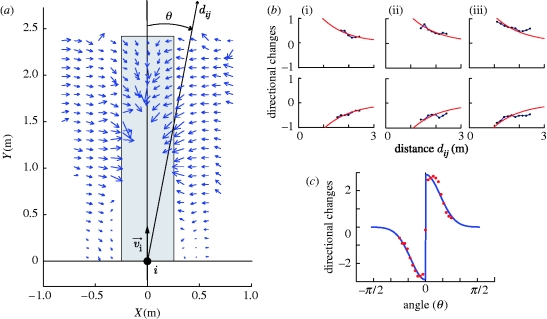
 , with fit parameter b. (c) A(θ) can then be approximated by the equation
  , where K is the sign of θ and a, c are fit parameters. The function fv(d, θ) for speed changes has been set according to a similar functional dependency.
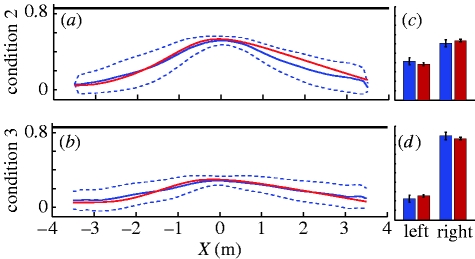
References
-
- Algadhi S. A. H., Mahmassani H. S., Herman R.2002A speed–concentration relation for bi-directional crowd movements with strong interaction. In Pedestrian and evacuation dynamics (eds Schreckenberg M., Deo-Sarma S.), pp. 3–20 Berlin, Germany: Springer
-
- Ame J.-M., Rivault C., Deneubourg J.-L.2004Cockroach aggregation based on strain odour recognition. Anim. Behav 68, 793–801 (doi:10.1016/j.anbehav.2004.01.009) - DOI
-
- Ame J.-M., Halloy J., Rivault C., Detrain C., Deneubourg J.-L.2006Collegial decision making based on social amplification leads to optimal group formation. Proc. Natl Acad. Sci. USA 103, 5835–5840 (doi:10.1073/pnas.0507877103) - DOI - PMC - PubMed
-
- Antonini G., Bierlaire M., Weber M.2006Discrete choice models of pedestrian walking behavior. Transp. Res. Part B 40, 667–687 (doi:10.1016/j.trb.2005.09.006) - DOI
-
- Arthur W.B.1990Positive feedbacks in the economy. Sci. Am 262, 92–99
Publication types
MeSH terms
LinkOut - more resources
Full Text Sources
Other Literature Sources