

Review
doi: 10.1128/JVI.00114-09.
Epub 2009 May 13.
T-cell vaccine strategies for human immunodeficiency virus, the virus with a thousand faces
Affiliations
- PMID: 19439471
- PMCID: PMC2738160
- DOI: 10.1128/JVI.00114-09
Item in Clipboard
Review
T-cell vaccine strategies for human immunodeficiency virus, the virus with a thousand faces
J Virol.
2009 Sep.
No abstract available
Figures
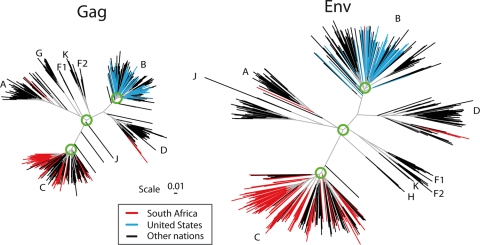
Phylogenetic trees of the major subtypes found in the HIV-1 M-group Gag and Env. These trees are based on the Los Alamos curated database of global alignment, as of December 2008, and contain one full-length gene per infected person. The trees show the relationships between the major HIV subtypes; intersubtype recombinants were excluded. The database represents global studies but not systematic sampling, as whatever sequences were published and are in GenBank are included in the HIV database. Only representative subsets of the most recently sampled B clade from the United States or C clade from South Africa were included in these trees, as these are the most heavily studied epidemics and dominate the global sampling. To illustrate how these regional single-subtype epidemics fit into the global picture, terminal lines for South African sequences are in red, those for United States sequences are in blue, and those for all other nations are in black. The green circles show the approximate region of the node selected for generation of the most recent common ancestor; in our ancestral reconstructions, we do not include the sequences that are outliers relative to the rest of the clade in these models. The trees are maximum likelihood trees using a general time-reversible model with site rate variation estimated with a gamma distribution and were generated using PhyML (40).
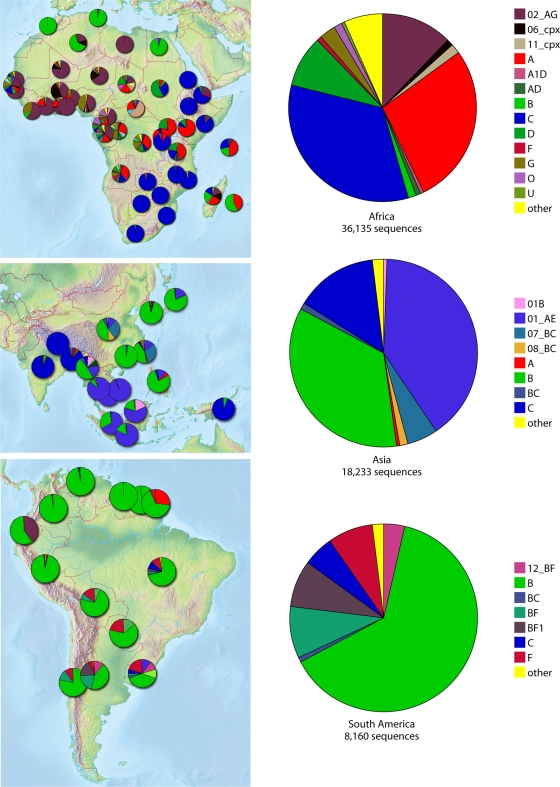
Maps showing the subtype designation of all sequences in the Los Alamos database as of 1 January 2009. These sequences are often single genes and fragments, so intersubtype recombination is underestimated. They are not sampled randomly but are the product of all HIV studies with sequences submitted to GenBank. Despite this limitation, the maps largely reflect what we know about global distributions of subtypes, but the details should be interpreted with caution. The figures were made using the HIV geography tool at the Los Alamos database (http://www.hiv.lanl.gov/components/sequence/HIV/geo/geo.comp ).
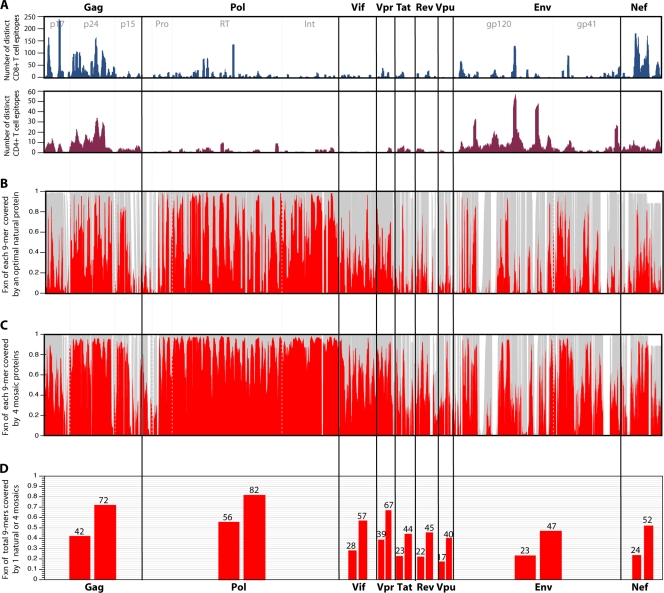
(A) Map of known and distinctive CD4+ and CD8+ epitopes described in the literature and included in the Los Alamos database across the proteome. Experimental maps of population responses (30) are tracked, with the exception of the underrepresentation of T-cell epitope mapping of regulatory proteins in the database. This underrepresentation is a consequence of regulatory protein T-cell epitope mapping being somewhat underrepresented in the literature. (B) The fraction (Fxn) of identical matches (red) with a single natural strain that provides the optimal coverage of the M group for each 9-mer (potential epitope) in the HIV proteome is shown. The optimal natural strain is a C-subtype sequence, C.ZA.99.DU422 (GenBank accession number AY043175). This is not surprising, as C is the most common subtype in the full-length genome database. This is an alignment-based figure; the gray background illustrates how many sequences have 9-mer in a given position in the alignment, such that a section in the alignment with an insertion in only one or a few sequences will appear as a white band. (C) Illustration of the increase in the fraction of perfectly matched 9-mers at each position when a four-mosaic combination is used rather than a single natural strain. (D) Total percentage of all 9-mers covered for each protein, corresponding to the single natural strain coverage shown in panel B (lower bar for each protein) and the four-mosaic coverage (higher bar) shown in panel C. The mosaic sequences were derived, optimal natural proteins were selected, and coverage graphics for both Fig. 3 and 4 were created using the mosaic vaccine tool suite at the Los Alamos HIV database (83) (http://www.hiv.lanl.gov/content/sequence/MOSAIC/ ). All comparisons were made to proteins translated from the global full-length genome alignment at the Los Alamos HIV database (http://www.hiv.lanl.gov/content/sequence/NEWALIGN/align.html ), so the same input set of full genome sequences were used for every protein; thus, the variability comparisons between proteins are reasonable.
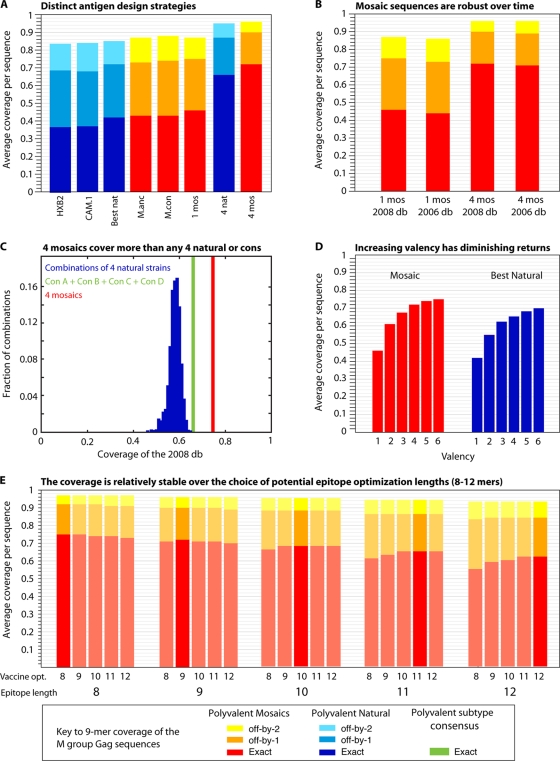
Comparisons that address key issues regarding mosaic and central sequence vaccine designs. All comparisons in this figure are based on Gag, but the relative rankings for Gag in this figure are paralleled, with differences in overall magnitude, by all HIV proteins, i.e., Gag is representative (B. T. Korber, data not shown). Blue represents natural proteins, and red represents mosaics. (A) Incrementally improved coverage of 9-mers in Gag in the global M-group alignment using different design strategies. From left to right, two single natural strains which have been used for vaccine studies, the single natural strain selected to provide the best 9-mer coverage, the M-group ancestor, the M-group consensus, a single mosaic, the four natural strains that in combination give the best coverage of Gag, and four mosaics. The single best natural Gag turns out to be a C-subtype sequence (see legend to Fig. 3). The four best natural Gags are a set that includes one C subtype, one B subtype, one AD recombinant type, and a CRF01 sequence. (B) Illustration of the robustness of these designs over time and with the acquisition of new data. The 2006 database mosaics were the four mosaic Gag sequences generated in a study by Fischer et al. (29) based on a set of 551 M-group sequences, one sequence per person, that were available for inclusion at the end of 2005 for the 2006 Los Alamos database. The current designs are based on the 2008 database full-length genome alignment, using sequences that were available at the end of 2007 for inclusion in the 2008 database. The 2008 database set of 1,206 Gag proteins was the test set used in both cases, and the 2006 database-derived mosaics provide almost the same coverage as the 2008 database-derived mosaics. Given the cost and time required for development and testing, and the robustness of the mosaic sequences over time and acquisition of new data, it does not make sense to continuously update mosaics during different stages of testing. (C) Comparison of the M-group 9-mer coverage based on 1,000 randomly selected sets of four natural proteins, a combination of four subtype consensus proteins (one A, one B, one C, and one D subtype consensus proteins, in green), and four mosaics. (D) Increasing the valence of a vaccine will enhance 9-mer coverage, but with diminishing returns, by inclusion of increasingly rare 9-mers. (E) Mosaic design is relatively robust against the length of potential epitopes used for the optimization (opt.) criteria.
References
-
- Abdel-Motal, U. M., J. Gillis, K. Manson, M. Wyand, D. Montefiori, K. Stefano-Cole, R. C. Montelaro, J. D. Altman, and R. P. Johnson. 2005. Kinetics of expansion of SIV Gag-specific CD8+ T lymphocytes following challenge of vaccinated macaques. Virology 333226-238. - PubMed
-
- Addo, M. M., X. G. Yu, A. Rathod, D. Cohen, R. L. Eldridge, D. Strick, M. N. Johnston, C. Corcoran, A. G. Wurcel, C. A. Fitzpatrick, M. E. Feeney, W. R. Rodriguez, N. Basgoz, R. Draenert, D. R. Stone, C. Brander, P. J. Goulder, E. S. Rosenberg, M. Altfeld, and B. D. Walker. 2003. Comprehensive epitope analysis of human immunodeficiency virus type 1 (HIV-1)-specific T-cell responses directed against the entire expressed HIV-1 genome demonstrate broadly directed responses, but no correlation to viral load. J. Virol. 772081-2092. - PMC - PubMed
-
- Almeida, J. R., D. A. Price, L. Papagno, Z. A. Arkoub, D. Sauce, E. Bornstein, T. E. Asher, A. Samri, A. Schnuriger, I. Theodorou, D. Costagliola, C. Rouzioux, H. Agut, A. G. Marcelin, D. Douek, B. Autran, and V. Appay. 2007. Superior control of HIV-1 replication by CD8+ T cells is reflected by their avidity, polyfunctionality, and clonal turnover. J. Exp. Med. 2042473-2485. - PMC - PubMed
-
- Altfeld, M., M. M. Addo, E. S. Rosenberg, F. M. Hecht, P. K. Lee, M. Vogel, X. G. Yu, R. Draenert, M. N. Johnston, D. Strick, T. M. Allen, M. E. Feeney, J. O. Kahn, R. P. Sekaly, J. A. Levy, J. K. Rockstroh, P. J. Goulder, and B. D. Walker. 2003. Influence of HLA-B57 on clinical presentation and viral control during acute HIV-1 infection. AIDS 172581-2591. - PubMed
Publication types
MeSH terms
Substances
LinkOut - more resources
Full Text Sources
Other Literature Sources
Medical
